ZnO逆修飾小尺寸Cu/SiO2催化劑及其在CO2加氫制甲醇中的應(yīng)用
2020-12-25 01:35:12呂翰林胡兵劉國亮洪昕林莊林
物理化學(xué)學(xué)報(bào) 2020年11期
關(guān)鍵詞:催化劑
呂翰林,胡兵,劉國亮,洪昕林,*,莊林,,*
1武漢大學(xué)高等研究院,武漢 430072
2武漢大學(xué)化學(xué)與分子科學(xué)學(xué)院,武漢 430072
1 Introduction
Catalytic hydrogenation of carbon dioxide (CO2) to methanol is one of the most important reactions due to its potential application in energy, environmental, and chemical industries1-7.As a broadly-used catalyst for methanol synthesis from CO2, Cu-ZnO catalysts are widely studied because of its high activity and economic superiority8-10. Small Cu particle size is the key to high-activity Cu-ZnO catalysts in terms of creating more Cu-ZnO interfaces, which are believed as the active sites for CO2reduction to methanol11,12. Yet, downscaling Cu size at high loading is a big challenge even today.
Typically, surfactants can be employed to control the size of nanoparticles13,14. Sunet al. synthesized the Cu-ZnO catalysts with Cu particles of 5 nm by the hydrothermal method under the protection of polyvinyl pyrrolidone (PVP) and confinement of silica shell, which shows high activity and stability in methanol synthesis15. However, surfactants are generally hard to remove,which affect the activity of the catalysts and the following characterization. Besides, dispersing metal particles on the support with a high specific surface area is also efficacious in the preparation of nanoparticles16-18, which can synthesize large amounts of catalysts without using surfactants. Nevertheless, the metal particle size is hard to control, especially in the catalyst with high metal loading or weak metal-support interaction. It’s also difficult to control the interaction between different components in multicomponent catalysts.
Copper silicate is a material with a complex structure and high specific surface area, which can be a promising precursor for synthesizing small-sized Cu/SiO2catalyst19-21. Meanwhile,copper silicate derived materials have not been widely studied as CO2reduction catalysts. Shenget al. synthesized a series of Cu/SiO2catalysts with Cu nanoparticles of 9 nm from singlewalled copper silicate doped by different 3D transition metals,among which the Zn- and Ni-doped catalysts have significantly improved performance in methanol production22. Wanget al.prepared Cu/SiO2 catalysts with Cu nanoparticles of 2 nm, which reduced from layered copper silicate under H2/Ar in different temperatures. They found that the activity depends on the molar ratio of Cu+to Cu0which is influenced by the reduced temperature23. However, copper silicate derived materials have not been employed to construct Cu-ZnO catalyst. In this work,we propose a simple and low-cost method to prepare a series of Cu-ZnO/SiO2catalysts with small-sized Cu particles and strong Cu-ZnO interaction. A series of Cu-ZnO/SiO2catalysts with different amounts of ZnO was prepared. The quantity of ZnO was optimized and the synergistic effect of Cu-ZnO was studied.
2 Experimental section
2.1 Catalyst preparation
Copper silicate was synthesized by the following procedure.Typically, 4 mL ammonia hydroxide (28% (w) NH3in water,Sinopharm Chemical Reagent, AR), 4 mL deionized water, and 6 mL tetraethyl orthosilicate (TEOS, Sinopharm Chemical Reagent, AR, USA) were added into 100 mL ethanol. The mixture was stirred under room temperature for 12 h to get SiO2colloids. SiO2was centrifuged and washed by ultrasonic in deionized water for three times, then dispersed in 48 mL water.2.4160 g Cu(NO3)2·3H2O (Sinopharm Chemical Reagent, AR,USA) was dissolved in 12 mL ammonia hydroxide to get the blue [Cu(NH3)4](NO3)2solution. The 48 mL SiO2 colloidal was added in the solution dropwise under stirring. The mixture was heated in water bath at 313 K and further stirred for 3 h, then transferred into a 100 mL Teflon autoclave and was heated up to 413 K for 10 h to get copper silicate. The precipitates were collected by centrifugation and washed with distilled water and ethanol by three times respectively, followed by a vacuum drying at 353 K for 12 h. The light blue product is copper silicate.Copper silicate was reduced under 10% H2/Ar to get Cu/SiO2.Copper silicate was also calcined in the muffle furnace at 723 K(heating rate: 2 K·min-1) for 4 h. The light green product is denoted as C-S-calcine.
Cu-ZnO/SiO2was synthesized by impregnation as the following procedures. 0.4 g Cu/SiO2was added into a 25 mL crucible. Different amounts of Zn(CH3COO)2·2H2O (Sinopharm Chemical Reagent, AR, USA) were dissolved in 10 mL ethanol and added into the crucible. The mixture was heated to 373 K to volatilize the solvent. Then the solid was heat up to 573 K and maintained for 2 h. The product is denoted as C-SiO2-x%ZnO(x% represents the weight fraction of ZnO). By adding different amounts of Zn(CH3COO)2·2H2O, C-SiO2-3.5%ZnO, C-SiO2-7%ZnO, C-SiO2-14%ZnO were prepared.
2.2 Characterization
Transmission electron microscopy (TEM) and High resolution transmission electron microscopy (HRTEM) images were obtained on a JEM-2100 (JEOL, Japan) to view the morphology of the catalysts.
Powder X-ray diffraction (XRD) patterns were performed on a Bruker D8 Advance (Bruker, Germany) with CuKαradiation.PDF #04-0836 (Cu) and #36-1451 (ZnO) were used to identify the crystalline phase. The particle size was calculated by Scherrer formula.
X-ray photoelectron spectroscopy (XPS) was carried out in an ESCALAB 250Xi (Thermo, USA) equipped with an Al anode(Al-Kα, 1486.7 eV).
In situdiffuse-reflectance infrared Fourier transform spectroscopy (DRIFTS) results were obtained on a Bruker Vertex 70 (Bruker, Germany) equipped with an MCT detector.The spectra resolution was set at 4 cm-1and the scan number is 32. Before testing, ~10 mg catalyst was placed into anin situchamber and mounted in an alumina IR cell. Then the sample was reduced in 10% H2/Ar flow (30 mL·min-1) for 1 h at 300 °C and then flushed by Ar flow (30 mL·min-1) at 300 °C for 30 min.After that, the sample was cooled to 30 °C and the corresponding background spectra were collected for subsequent DRIFTS analysis. Then the gas was changed to a stream of 5% CO/He at a flow rate of 30 mL·min-1under atmospheric pressure. After the CO adsorption for 30 min, the IR chamber was purged with Ar to remove gaseous CO. After 30 min, the time-resolved DRIFTS spectra were collected under Ar flow.
Inductively coupled plasma-atomic emission spectroscopy(ICP-AES) spectra were acquired on IRIS Intrepid II XSP equipment (Thermo, USA) to confirm the metal content in the as-synthesized catalysts.
N2sorption measurements were conducted at 77 K on an ASAP 2020 (Micromeritics, USA). Brunauer-Emmett-Teller(BET) multilayer-sorption model was used to calculate the surface area and the Barrett-Joyner-Halenda (BJH) method was employed to obtain the pore volume.
Temperature-programmed reduction (TPR) experiments were carried out on an AutoChem 2920 (Micromeritics, USA) to investigate the surface atoms of the Cu particles. In TPR tests,0.1 g sample was used and pretreated as the following process.The sample was reduced in 30 mL·min-1of 5% H2/Ar at 573 K with the heating rate of 5 K·min-1for 2 h and cooled down to 313 K under 20 mL·min-1Ar flux. Then N2O flew through at a rate of 20 mL·min-1to oxidize the surface copper at 333 K for 1 h. The sample was heated to 423 K at a rate of 5 K·min-1under Ar flux at a rate of 20 mL·min-1and maintained for 30 min to purge the residual N2O. After that, the sample was cooled down to 313 K, and the pretreatment was finished. The atmosphere was switched to 5% H2/Ar (flowing rate: 30 mL·min-1) and the sample was heated up to 553 K at a rate of 10 K·min-1. At the same time, the thermal conductivity detector (TCD) started to record the surface-H2-TPR profile. The TPR peak area was integrated and calculated into H2-consumption. The number of surface copper atoms is twice the number of H2molecules consumed as shown in Equations (1) and (2)
2.3 Catalytic test
The catalytic tests were carried out in a continuous-flow tubular fix-bed reactor. Catalysts were pressed under 5 MPa of pressure and grounded. Then 0.2 g of the catalyst was loaded into the reaction tube with a certain amount of quartz fiber.Before the test, catalysts were reduced under a 10% H2/Ar flux with a rate of 50 mL·min-1at 573 K for 2 h. After that, the reaction tube was cooled down to 423 K. The atmosphere was switched to H2/CO2(molar ratio: 3 : 1) at a flow rate of 400 mL·min-1. When the backpressure reached 4.5 MPa, the flow rate was set as 36 mL·min-1, corresponding to a weight hourly space velocity (WHSV) of 7200. In the test, the reaction tube was heated up to the target reaction temperature within the range of 503-543 K with a heating rate of 2 K·min-1. Post-reactor lines and valves were heated up to 423 K to avoid product condensation. The products were detected online by a gas chromatography (GC) with a TCD and Porapak-Q column.Conversion and selectivity were calculated from the last three sets of GC spectra collected every 5 min throughout a reaction time of 3 h.
3 Results and discussion
3.1 Material characterization
The copper silicate sample was synthesized by a hydrothermal method and then characterized by XRD, TEM, and N2-sorption measurements. XRD results are shown in Fig. 1a, which corresponds to the pattern of chrysocolla. TEM images in Fig.1b show that the copper silicate sample is accumulated by copper silicate nanotubes with an inner diameter of 3 nm and a thickness of 2 nm. Fig. 1c shows the nitrogen sorption isotherm of copper silicate, which belongs to mesoporous materials (Type IV)24.Fig. 1d shows the pore size distribution calculated from the nitrogen desorption isotherm. It illustrates that there are smaller mesopores of 2.6-2.9 nm and larger mesopores of tens of nanometers, which correspond to the inner diameter and the length of nanotubes shown in TEM images, respectively. The Cu/SiO2sample reduced from copper silicate was also characterized by TEM. As the images are shown in Fig. S1c,copper silicate was reduced to Cu particles and SiO2 nanotubes.Fig. S1a,b (in Supporting Information) show the Cu particles outside the SiO2nanotube with a particle diameter around 8 nm and Cu particles with a diameter smaller than 5 nm inside the SiO2nanotube, which demonstrates the confinement of SiO2nanotubes.
Fig. 1 Characterization of synthesized copper silicate.(a) XRD, (b) TEM, (c) N2 physisorption isotherm linear plot and (d) pore size distribution calculated from the desorption isotherm.
Fig. 2a shows the XRD patterns of the C-SiO2-3.5%ZnO, CSiO2-7%ZnO, and C-SiO2-14%ZnO. All samples present the X-ray diffraction peaks of CuO, which indicates Cu species was oxidized during the solvent’s volatilization. Meanwhile, the peak width of CuO decreases with more ZnO, demonstrating that Cu species aggregate with the addition of ZnO. The strong diffraction peaks of ZnO located at 31.77°, 34.42°, 36.25° of 2θare covered by the signals of CuO. Only in the pattern of C-SiO2-14%ZnO, the three peaks of ZnO are visible. The contents of copper and zinc were determined by ICP-AES. As it is shown in Table 1, the catalysts have a high loading of Cu around 25%, and ZnO of 2.9%, 5.5%, 11.0% by adding different amounts of Zn precursor. The specific surface area and pore volume, calculated based on nitrogen sorption isotherms in Fig. 2b, decrease with the increase of ZnO content. XPS was also employed to characterize the catalysts, and the patterns are shown in Fig. S2(in Supporting Information). It observed that the intensity of Zn 2ppeaks increased with the adding of Zn precursor, which is evidence for successful impregnation.
3.2 Catalytic performance
Fig. 2 (a) XRD and (b) N2 physisorption isotherm linear plot of C-S-calcine and C-SiO2-x%ZnO before the catalytic test.
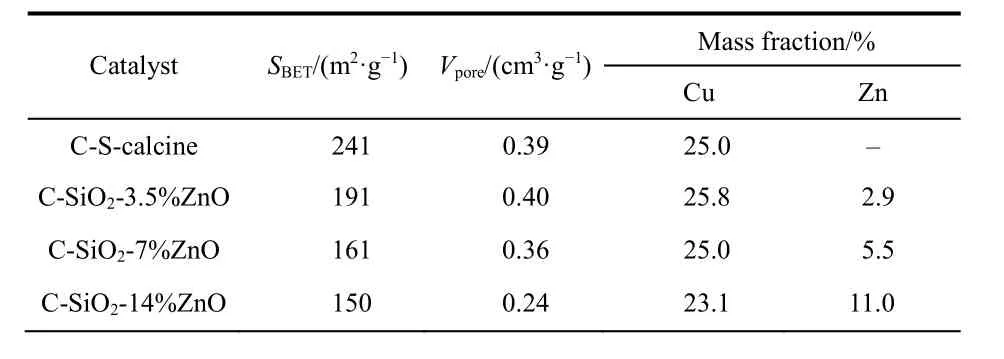
Table 1 The BET surface area and the porosity of C-S-calcine and C-SiO2-x%ZnO, as well as the elemental composition data of C-S-calcine and C-SiO2-x%ZnO.
The catalytic activities of C-SiO2-x%ZnO catalysts in the hydrogenation of CO2to methanol were tested at temperatures between 503 K and 543 K, with the catalytic performance of CS-calcine (which stands for Cu/SiO2, prepared by reduction of copper silicate) as a reference. The results are shown in Fig. 3 including the conversion of CO2, the methanol selectivity, and space time yield (STY) of methanol. As Fig. 3a shows, the selectivity to methanol is observably elevated by the increasing of ZnO, especially at low temperatures. At 503 K, with the addition of ZnO from 0 to 14% (w), the selectivity to methanol increases from 20.5% to 45.0%, 55.2%, and 66.8%, respectively.For ZnO containing catalysts, raising the reaction temperature results in a higher conversion of CO2but a lower selectivity to methanol. The CO2conversion of C-SiO2-3.5%ZnO and C-SiO2-7%ZnO reverse from low temperature (503 K, 523 K) to high(533 K, 543 K). C-SiO2-14%ZnO shows a lower conversion of CO2than the ZnO-free C-S-calcine catalyst, which might be attributed to the accretion of Cu particles. As a result, the STY of methanol synthesis shows a volcano relationship with the content of ZnO, and the optimum result of 244 g·kg-1·h-1was obtained on C-SiO2-7%ZnO, which can be comparable to the activity of several reported high-activity Cu/ZnO catalysts at the similar reaction condition15,25-29.
The spent catalysts after the catalytic tests were also characterized by XRD. The XRD results are shown in Fig. 4. The peaks of 2θlocated at 43.3°, 50.4°, and 74.1° belong to metallic Cu, which is the main form of Cu element. Meanwhile, the peak at 36.4° is assigned to cuprite (Cu2O), which might be reduced from the CuO having strong interaction with the SiO2support.Note that we can see the diffraction peaks for crystal ZnO disappear, which indicates that the particle size of ZnO is tiny and well dispersed onto Cu/SiO2. This ensures a strong interaction between ZnO and Cu.
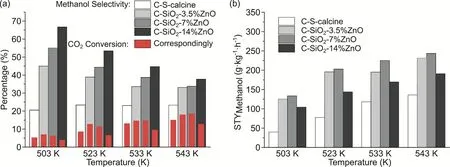
Fig. 3 Catalytic performance of C-SiO2-x%ZnO for CO2 reduction to methanol.(a) selectivity to methanol and conversion of CO2, (b) space time yield (STY) of methanol formation, color online.
3.3 Synergistic effect of Cu-ZnO
HRTEM was employed to characterize the catalysts after the hydrogenation reaction. Fig. 5 and Fig. S4 (in Supporting Information) shows the HRTEM and the fast Fourier Transform(FFT) images of the after-reaction C-SiO2-3.5%ZnO, C-SiO2-7%ZnO and C-SiO2-14%ZnO. For C-SiO2-3.5%ZnO with low loading of ZnO, only a small amount of ZnO as Fig. 5a and several independent particles as Fig. 5b with Cu particles nearby were found which means the Cu particles hardly have the opportunities to interact with ZnO. With more ZnO added, the lattice fringe of ZnO becomes more common as it is shown in Fig. 5c,d. In the C-SiO2-14%ZnO, we found individual particles of ZnO with a diameter of 2 nm on SiO2support as Fig. 5e. In Fig. 5f, it was not only ZnO nanoparticles but also layers of ZnO,which partially covering the Cu2O nanoparticles were observed.As a result, Cu particles have more opportunities to contact with ZnO, which contributes to stronger Cu-ZnO interaction.
XPS and Auger spectra were used to identify the valence of Cu species in catalysts. Fig. 6 shows the Cu 2p(a) and CuLMM(b) patterns. In Fig. 6a, the peaks located at 933.1 eV and 953.0 eV belong to Cu0and Cu+. The peaks at 935.5 eV and 955.8 eV are assigned to Cu2+. The Cu-LMM Auger spectra (Fig. 6b) are fitted into the following three peaks: 572.7, 570.8, and 568.8 eV correspond to Cu+, Cu2+, and Cu0, respectively30-32. The proportion of Cu species was calculated based on the main peak of Cu 2p3/2and Cu-LMM pattern. As shown in Table S1 (in Supporting Information), Cu+species exist in all the C-SiO2-x%ZnO catalyst. The highest Cu+/Cutotalof 47% was obtained on C-S-calcine, which decreased to 38%, 29%, and 19% by adding 3.5%, 7%, and 14% ZnO, respectively.
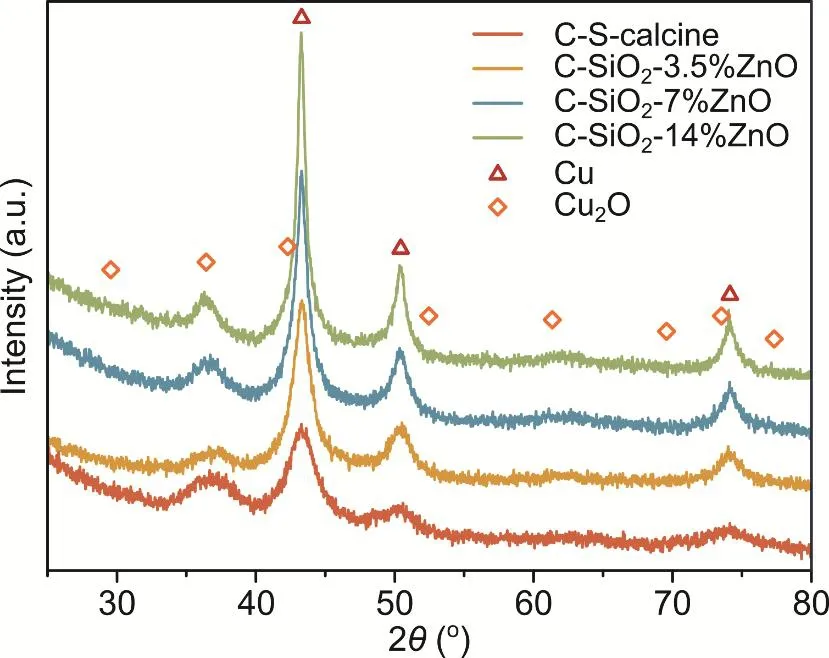
Fig. 4 XRD of C-S-calcine and C-SiO2-x%ZnO after the catalytic test.

Fig. 5 HRTEM image of (a, b) C-SiO2-3.5%ZnO,(c, d) C-SiO2-7%ZnO, and (e, f) C-SiO2-14%ZnO.
To further confirmed the existence of Cu+,in situDRIFTS was used to characterize the adsorbed CO on Cu+species in catalysts.The spectra were shown in Fig. 7 and Fig. S5 (in Supporting Information). The bands in Fig. 7 at 2123 cm-1and in Fig. 7b-d at 2129 cm-1are assigned to the adsorbed CO on Cu+sites33.The slight red shift of CO-Cu+might be caused by the Cu-ZnO interaction. The asymmetry of the CO adsorption band is attributed to the co-existence of adsorbed CO on Cu0(2100 cm-1). The comparison of CO-DRIFTS on catalysts with different amounts of ZnO was shown in Fig. S5 (in Supporting Information). It can be observed that the intensity of the CO-Cu+band decrease with the amount of ZnO, illustrating that ZnO depresses the formation of Cu+species, which agrees well with the result of XPS. The proportion of Cu species and the activity of C-SiO2-x%ZnO catalyst were listed in Table S1 (in Supporting Information). The methanol selectivity increases with the decreasing of Cu+/Cutotal, which indicates that the Cu-ZnO interface is the active site of methanol synthesis in C-SiO2-x%ZnO.
The apparent activation energies (Ea) for CO2hydrogenation to methanol and reverse water gas shift (RWGS) were calculated by Arrhenius Equation. As the Arrhenius plots are shown in Fig.S3, theEaof methanol synthesis decreases from 72.5 kJ·mol-1to 48.9 kJ·mol-1, 45.7 kJ·mol-1, and 34.8 kJ·mol-1by adding different amounts of ZnO. As for the RWGS, theEa increases from 61.3 kJ·mol-1to 64.2 kJ·mol-1, 84.5 kJ·mol-1, and 102.7 kJ·mol-1, which indicates that ZnO promotes the methanol synthesis and inhibit the RWGS.
H2-TPR was performed to characterize the Cu species on the surface of catalysts, and the results are shown in Fig. 8 and Table 2. We calculated the specific surface area of Cu according to the peak area of the H2consumption. The Cu particle diameter was also calculated according to TPR by following equation34,35:

where SKis the constant depending on particle shape (6).CMis the number of Cu atoms per unit surface area (1.47 × 10¹⁹atoms·m-2).WCu is the weight fraction of Cu (w).NA is Avogadro’s Number (6.022 × 10²³mol-1).ρCuis the density of copper (8.92 g·cm-3). MolHis the mole of H2consumed per unit mass of catalyst in H2-TPR (mol·g-1). We also calculated the particle size by Scherrer Formula using the full width at half maximum intensity (FWHM) of Cu(111).
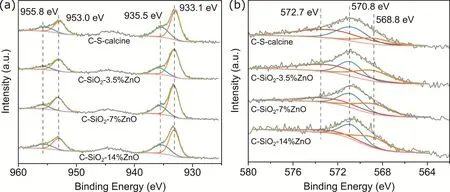
Fig. 6 Deconvolution of (a) Cu 2p and (b) Cu-LMM Auger XPS spectra for the C-SiO2-x%ZnOcatalysts.
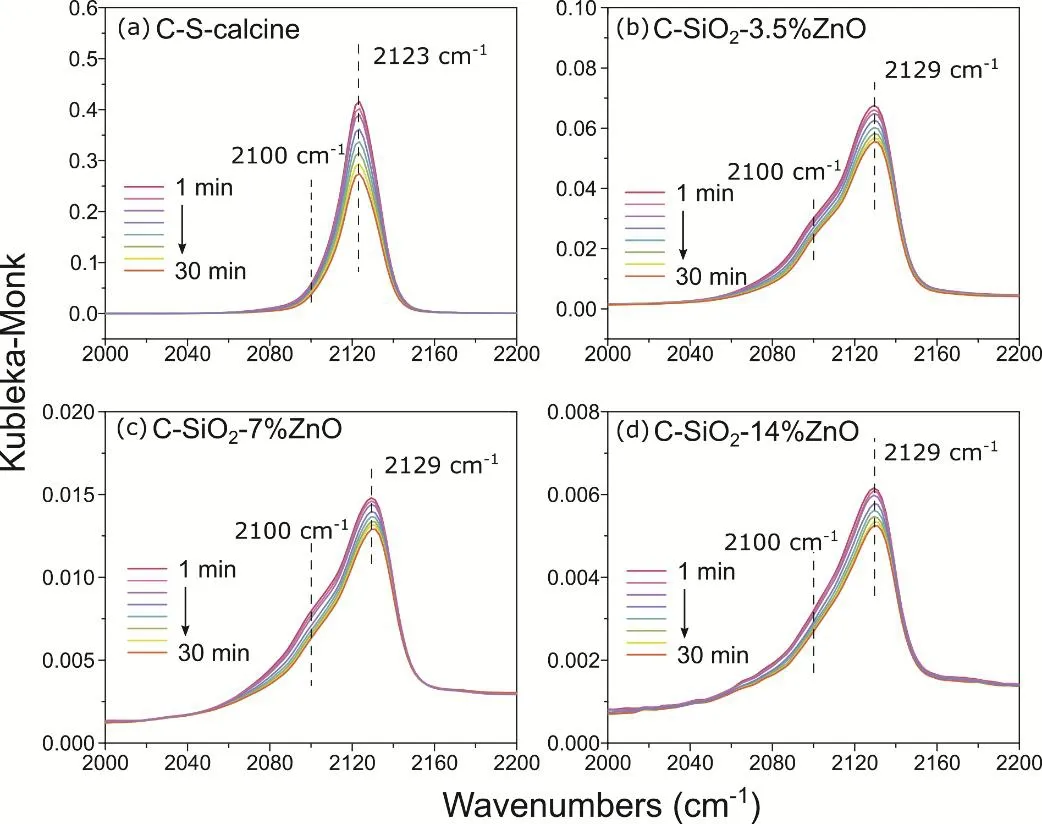
Fig. 7 In situ DRIFTS spectra of CO adsorption on C-SiO2-x%ZnO catalysts.
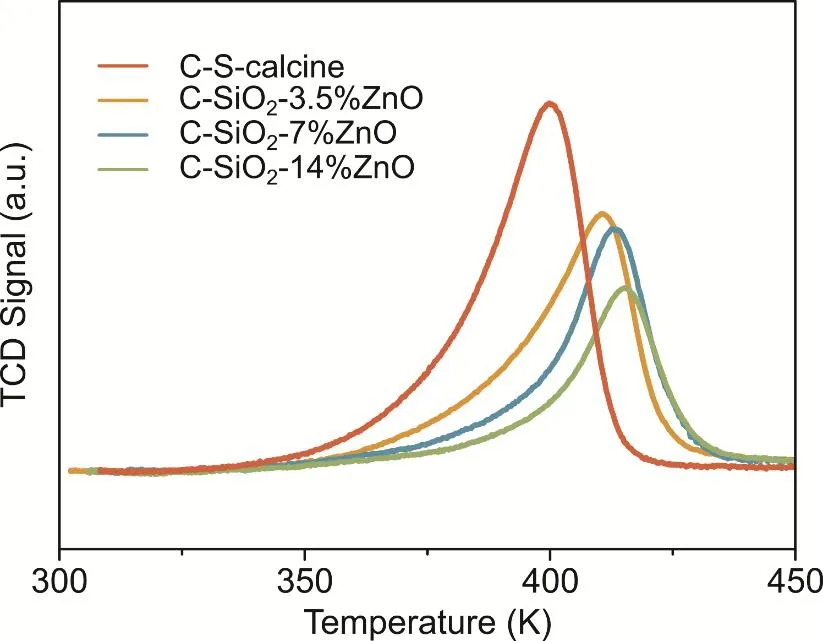
Fig. 8 H2-TPR of C-S-calcine and C-SiO2-x%ZnO after the catalytic test.
In Table 2, the C-S-calcine sample shows the lowest reduction temperature at 403 K. Just by adding a designated 3.5% ZnO, the reduction peak of C-SiO2-3.5%ZnO have a major shift to 411 K.While the Cu size difference between C-S-calcine and C-SiO2-3.5%ZnO is tiny, this shift is evidence for the interaction between Cu and ZnO. By adding more ZnO, the reduction temperature further increases to 413 K, 415 K respectively,which due to the increasing interaction between Cu and ZnO.The particle diameters calculated by TPR and XRD are similar,which increases from 4-5 nm to 9 nm with the increasing amount of ZnO. Note that the particle size calculated by H2-TPR is smaller than that calculated by XRD in C-SiO2-14%ZnO, which indicates that Cu particles are partially covered by ZnO, which could decrease the Cu surface and further affect the catalytical activity of catalysts. The methanol turnover frequency (TOF)was calculated based on the assumption that Cu is the active site(Table 1). It can be observed that the TOF of methanol on all the catalysts is promoted by raising reaction temperature. With theaddition of ZnO less than 7%, the TOF of catalysts under test temperatures increase from 0.46-0.5 to 2-4 (10-3s-1). However,when the weight fraction of ZnO is higher than 7%, the promotion effect becomes weak. The maximum TOF of 3.9 ×10⁻³s-1was obtained on C-SiO2-14%ZnO under 543 K, which has the same magnitude as the Cu/ZnO catalysts reported by Gaoet al.36. Fujitaniet al.found that the optimum TOF for the methanol formation on Cu(111) surface with coverage of ZnO at 0.19 was 13 times larger than that of ZnO-free Cu(111) surface37.It noted that Fujitani also found that ZnO species act as a promoter on Cu(111) while as a poison on Cu(110) surface for methanol synthesis38. Yoshihara and Campbell discovered that the hydrogenation of CO2to methanol on Cu(110) surface is 4 times faster than Cu(111) surface39. In C-SiO2-x%ZnO catalysts,the addition of ZnO promotes the creation of Cu-ZnO interface,but also the accretion of Cu particles. Although the interaction of Cu-ZnO is continuously growing with the addition of ZnO,which reflected in the decreasingEaof methanol synthesis and the increasingEaof RWGS, the high-index facets are still reducing with the accretion of Cu particles, which leads to the decrease of the total number of active sites. Meanwhile,considering the poison effect of ZnO on Cu(110), the growing ratio of low-index facets will affect the conversion of CO2.Therefore, C-SiO2-14%ZnO with more ZnO but larger Cu particles shows a similar TOF with C-SiO2-7%ZnO, and the activities of C-SiO2-x%ZnO show a volcano relationship with the weight fraction of ZnO.

Table 2 Cu SA and diameter calculated based on H2-TPR and XRD, as well as the calculated methanol turnover frequency of C-SiO2-x%ZnO.
4 Conclusions
In summary, we have demonstrated a simple and low-cost method for synthesizing small-sized Cu-ZnO/SiO2catalysts derived from copper silicate, in which the Cu-ZnO interaction can be controlled by adding different amounts of Zn precursor.During the catalytic test, we find that the methanol selectivity was promoted by the addition of ZnO. However, the conversion of CO2increased firstly, then decreased with the weight fraction of ZnO. As a result, the maximum STY of 244 g·kg-1·h-1was obtained on C-SiO2-7%ZnO under 543 K and 4.5 MPa H2/CO2.The synergistic effect between Cu and ZnO was studied by HRTEM and H2-TPR, which both show the increasing Cu-ZnO interaction with adding ZnO. Cu valence was examined by XPS and DRIFTS. The results show that Cu+species decreases with the increasing of ZnO, confirming that Cu0-ZnO interfaces are active sites. It’s also observed that Cu particles aggregate and covered by ZnO with the excess addition of ZnO, which contributes to the decline of the number of active sites. This work shows the potential of copper silicate to construct Cu-ZnO catalysts and confirmed the remarkable promotion of ZnO to Cu particle size, which further affects the activity of the catalyst for CO2reduction to methanol.
Supporting Information:available free of chargeviathe internet at http://www.whxb.pku.edu.cn.
猜你喜歡
大自然探索(2023年7期)2023-11-14 13:08:06
石油石化綠色低碳(2019年6期)2019-02-13 09:39:01
石油石化綠色低碳(2019年6期)2019-01-14 01:16:22
智富時(shí)代(2018年3期)2018-06-11 16:10:44
浙江大學(xué)學(xué)報(bào)(工學(xué)版)(2016年11期)2016-06-05 09:21:04
Coco薇(2016年2期)2016-03-22 02:45:06
超硬材料工程(2016年1期)2016-02-28 22:20:04
中國資源綜合利用(2016年4期)2016-01-22 08:27:23
合成化學(xué)(2015年4期)2016-01-17 09:01:27
應(yīng)用化工(2014年3期)2014-08-16 13:23:50