連續性抽樣調查中總體均值的估計
2015-04-25 07:19:16高莉菁
統計與決策 2015年1期
高莉菁
(暨南大學 經濟學院統計學系,廣州 510632)
0 引言
由于社會經濟現象在不斷的發展變化,一次性抽樣調查已經不足以及時反映總體的變化和發展,因此出現了連續性抽樣調查,通過連續性抽樣調查能夠得出對總體數字特征的更加可靠的估計。在連續性抽樣調查中,樣本輪換方法被廣泛采用,由于其既吸收了固體樣本調查和重復樣本調查的優點,又克服了兩者的缺點,能夠反映總體單位特點的變化和總體結構的變化。本文介紹幾種在輔助信息的總體均值未知的情況下,利用二階段輪換樣本連續抽樣來估計當期總體均值的估計量,并通過數值模擬來比較其性質,并給出一些合理建議。
1 估計量的公式
1.1 抽樣設計

1.2 公式表示

1.3 偏差和均方誤差

定理2Ti(i=1,2)的均方誤差線性近似為:

1.4 Ti(i=1,2)的最小均方誤差

1.5 最優輪換策略
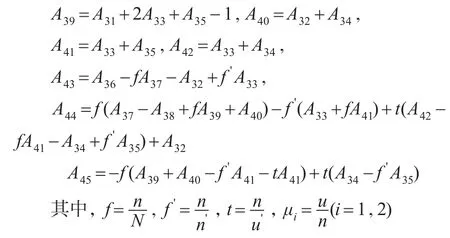
為了最小化式(14)和式(15)給出的均方誤差,需要考慮最優的樣本輪換率。最小化式(14)和式(15)式中得到如下的二次方程,相應的μi(i=1,2)如下:

2 數值分析


表1 最優的樣本輪換率以及相對效率
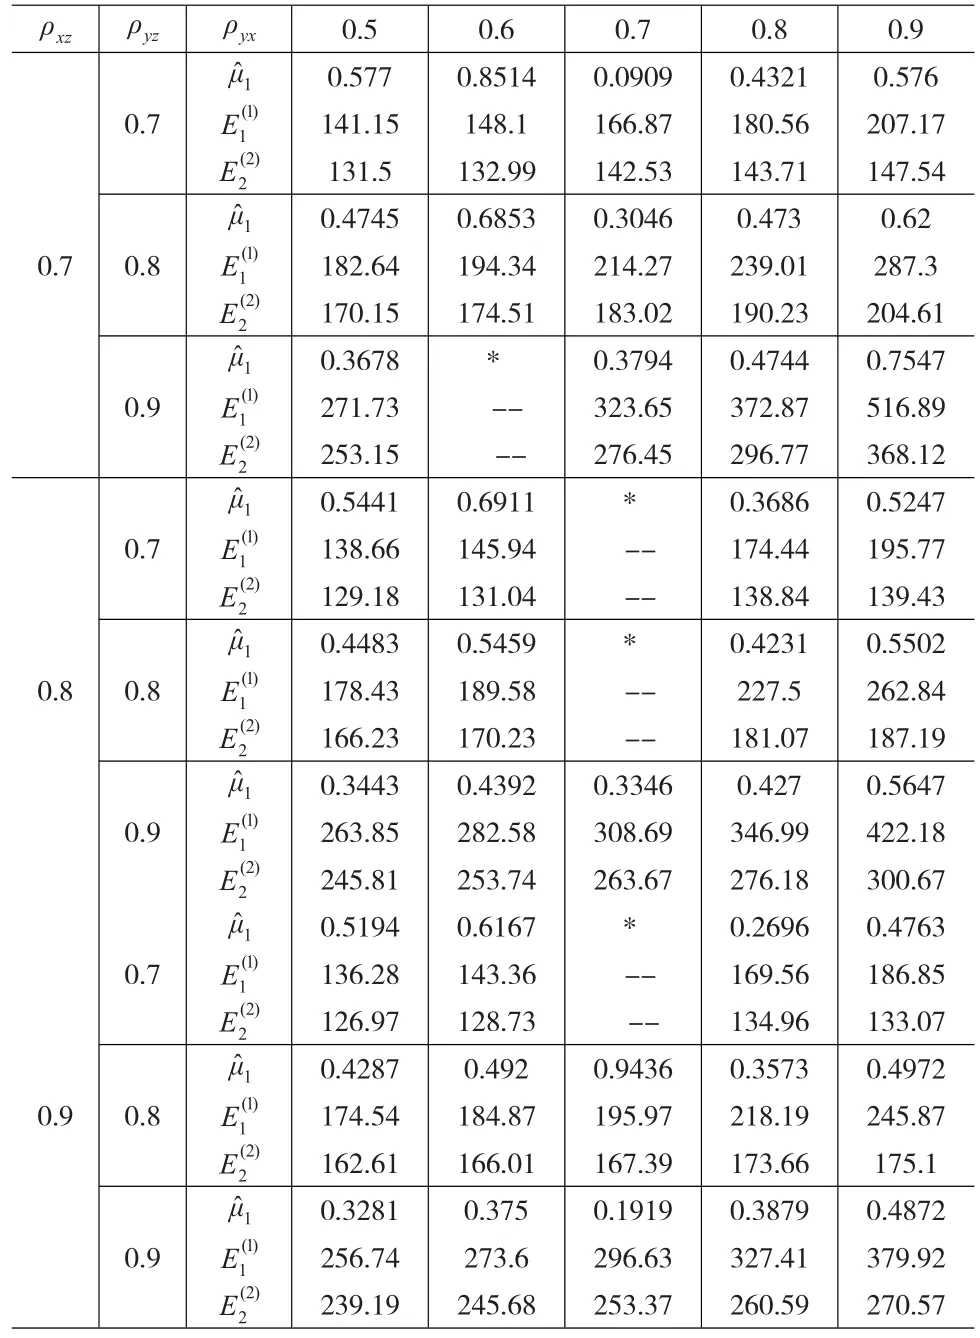
表1 最優的樣本輪換率以及相對效率
0.9 0.576 207.17 147.54 0.62 287.3 204.61 0.7547 516.89 368.12 0.5247 195.77 139.43 0.5502 262.84 187.19 0.5647 422.18 300.67 0.4763 186.85 133.07 0.4972 245.87 175.1 0.4872 379.92 270.57 ρxz ρyz 0.7 0.8 ρyx μ^1 1 E(1)0.7 2 μ^1 E(1)1 E(2)2 0.9 1 μ^1 E(2)E(1)2 μ^1 E(1)0.71 E(2)E(2)2 E(1)μ^1 0.8 0.81 E(2)2 E(1)μ^1 0.91 E(2)2 μ^1 0.7 E(1)1 E(2)2 0.8 0.9 E(1)μ^11 E(2)2 μ^1 0.9 E(1)1 E(2)2 0.5 0.577 141.15 131.5 0.4745 182.64 170.15 0.3678 271.73 253.15 0.5441 138.66 129.18 0.4483 178.43 166.23 0.3443 263.85 245.81 0.5194 136.28 126.97 0.4287 174.54 162.61 0.3281 256.74 239.19 0.6 0.8514 148.1 132.99 0.6853 194.34 174.51*----0.6911 145.94 131.04 0.5459 189.58 170.23 0.4392 282.58 253.74 0.6167 143.36 128.73 0.492 184.87 166.01 0.375 273.6 245.68 0.7 0.0909 166.87 142.53 0.3046 214.27 183.02 0.3794 323.65 276.45*----*----0.3346 308.69 263.67*----0.9436 195.97 167.39 0.1919 296.63 253.37 0.8 0.4321 180.56 143.71 0.473 239.01 190.23 0.4744 372.87 296.77 0.3686 174.44 138.84 0.4231 227.5 181.07 0.427 346.99 276.18 0.2696 169.56 134.96 0.3573 218.19 173.66 0.3879 327.41 260.59
表2 最優的樣本輪換率以及相對效率

表2 最優的樣本輪換率以及相對效率
ρxz ρyz 0.7 ρyx μ^2 E(1)2 E(2)2 μ^2 0.7 0.8 E(1)2 E(2)2 0.9 2 μ^2 E(2)E(1)2 μ^2 0.7 E(1)2 E(2)2 E(1)μ^2 0.8 0.82 E(2)2 μ^2 0.9 E(1)2 E(2)2 μ^2 0.7 E(1)2 E(2)2 0.8 0.9 E(1)μ^2 2 E(2)2 μ^2 0.9 E(1)2 E(2)2 0.5 0.4166 152.86 142.41 0.3848 191.49 178.4 0.3249 277.33 258.38 0.4084 149.99 139.74 0.375 187.02 174.23 0.3136 269.3 250.89 0.4008 147.31 137.24 0.366 182.91 170.41 0.3036 262.07 244.15 0.6 0.444 162.41 145.84 0.4142 204.78 183.88 0.3563 299.13 268.61 0.4336 158.81 142.61 0.4015 199.05 178.74 0.3409 288.53 259.09 0.4242 155.5 139.63 0.3901 193.89 174.11 0.3277 279.25 250.75 0.7 0.4797 174.81 149.32 0.4542 222.55 190.09 0.4021 329.69 281.61 0.4659 170.05 145.25 0.4365 214.73 183.41 0.379 314.46 268.59 0.4536 165.77 141.59 0.4212 207.89 177.57 0.3601 301.7 257.7 0.8 0.5303 192.22 152.99 0.5147 248.91 198.11 0.4817 379.51 302.06 0.5102 185.32 147.5 0.4868 236.86 188.52 0.4391 353.34 281.23 0.4929 179.35 142.75 0.4641 226.93 180.61 0.408 333.51 265.45 0.9 0.6149 220.87 157.3 0.634 298.85 212.83 0.755 524.56 373.58 0.5788 208.71 148.64 0.5729 273.61 194.86 0.5679 429.28 305.73 0.5505 199.1 141.79 0.5314 256.04 182.35 0.4936 386.63 275.35
3 結論

綜上所述,本文介紹的估計量能夠在估計精度上有較大提高,同時也可以減少調查成本,如果能夠在實踐中合理利用,將有利于推動我國統計調查體系的改進和完善,降低調查成本,提高統計數據的質量,更好的為社會各界服務。
[1]Singh G N,Majhi D,Prasad S.Estimation of Population Mean in two-phase Successive Sampling[C].Dhanbad:Recent Advances in Information Technology(RAIT).1st International Conference on.2012.
[2]Singh G N,Priyanka K.On the Use of Chain-type Ratio to Difference Estimator in Successive Sampling[J].IJAMAS,2006,(5).
[3]Singh G N Kumari P.On the Use of Auxiliary information in Search of Good Rotation Patterns on Successive Occasions.[J].International Journal of Statistics&Economics,2007,(1).
[4]Singh G N,Priyanka K.Search of Good Rotation Patterns to Improve the Precision of Estimates at Current Occasion[J].Communications in Statistics—Theory and Methods,2008.37(3).
[5]Singh G N,Karna J P.Estimation of Population Mean on Current Occasion in two-occasion Successive Sampling[J].METRON,2009,LXVII(1).
[6]Singh G N,Prasad S.Some Estimators of Population Mean in two-occasion Rotation Patterns[J].Association For The Advancement Of Modeling And Simulation Techniques In Enterprises,2010,(12).
[7]Singh G N,Prasad S,Karna J.Some Classes of Estimators for population Mean at Current Occasion in two-occasion Successive Sampling[J].Journal of Statistical Research,2011,45(21).
[8]Singh G N,Prasad S.Some Rotation Patterns in two-Phase Sampling[J].Statistics in Transition,2011,(12).