生產(chǎn)率增長(zhǎng):全球模式、決定因素及其在中國(guó)的應(yīng)用(下)
2019-11-05 04:41:23金墉諾曼·勞亞
中國(guó)經(jīng)濟(jì)報(bào)告 2019年5期
金墉 諾曼·勞亞
【提要】本文是世界銀行長(zhǎng)期增長(zhǎng)模型項(xiàng)目(LTGM)關(guān)于生產(chǎn)率的擴(kuò)展研究。通過(guò)對(duì)文獻(xiàn)的回顧,本文識(shí)別了經(jīng)濟(jì)生產(chǎn)率的五個(gè)主要決定因素:創(chuàng)新、教育、市場(chǎng)效率、基礎(chǔ)設(shè)施和制度。本文構(gòu)建了代表生產(chǎn)率決定因素各主要類別的指標(biāo)體系,并通過(guò)主成分分析法將多指標(biāo)轉(zhuǎn)化為一個(gè)總體指標(biāo)。我們的數(shù)據(jù)來(lái)源于1985-2015年間100多個(gè)國(guó)家。同時(shí),本文提出了一個(gè)測(cè)算全要素生產(chǎn)率(TFP)的方法,并評(píng)估了不同地區(qū)和收入群體的生產(chǎn)率增長(zhǎng)模式。本文還考察了TFP與五個(gè)決定因素之間的關(guān)系。通過(guò)將生產(chǎn)率增長(zhǎng)的差異分解為五個(gè)決定因素所解釋的份額,可以確定生產(chǎn)率增長(zhǎng)與總體決定指標(biāo)之間的關(guān)系。結(jié)果顯示,在決定TFP增長(zhǎng)差異的因素中,近10年來(lái)對(duì)OECD國(guó)家和發(fā)展中國(guó)家的TFP增長(zhǎng)影響最大的因素分別是市場(chǎng)效率和教育。回歸結(jié)果表明,在控制了國(guó)別效應(yīng)和時(shí)間效應(yīng)后,TFP增長(zhǎng)與我們所提出的TFP決定因素指標(biāo)具有顯著的正向關(guān)系,與初始TFP具有負(fù)向關(guān)系。在此基礎(chǔ)上,本文模擬了TFP增長(zhǎng)的潛在路徑,并基于地理區(qū)位和收入水平的區(qū)別介紹了不同國(guó)家的模擬結(jié)果。此外,本文模擬了中國(guó)在不同情境下的TFP增長(zhǎng)潛在路徑。
【關(guān)鍵詞】生產(chǎn)率;創(chuàng)新;教育;效率;基礎(chǔ)設(shè)施;制度;增長(zhǎng)
四、結(jié)果
(一)全要素生產(chǎn)率
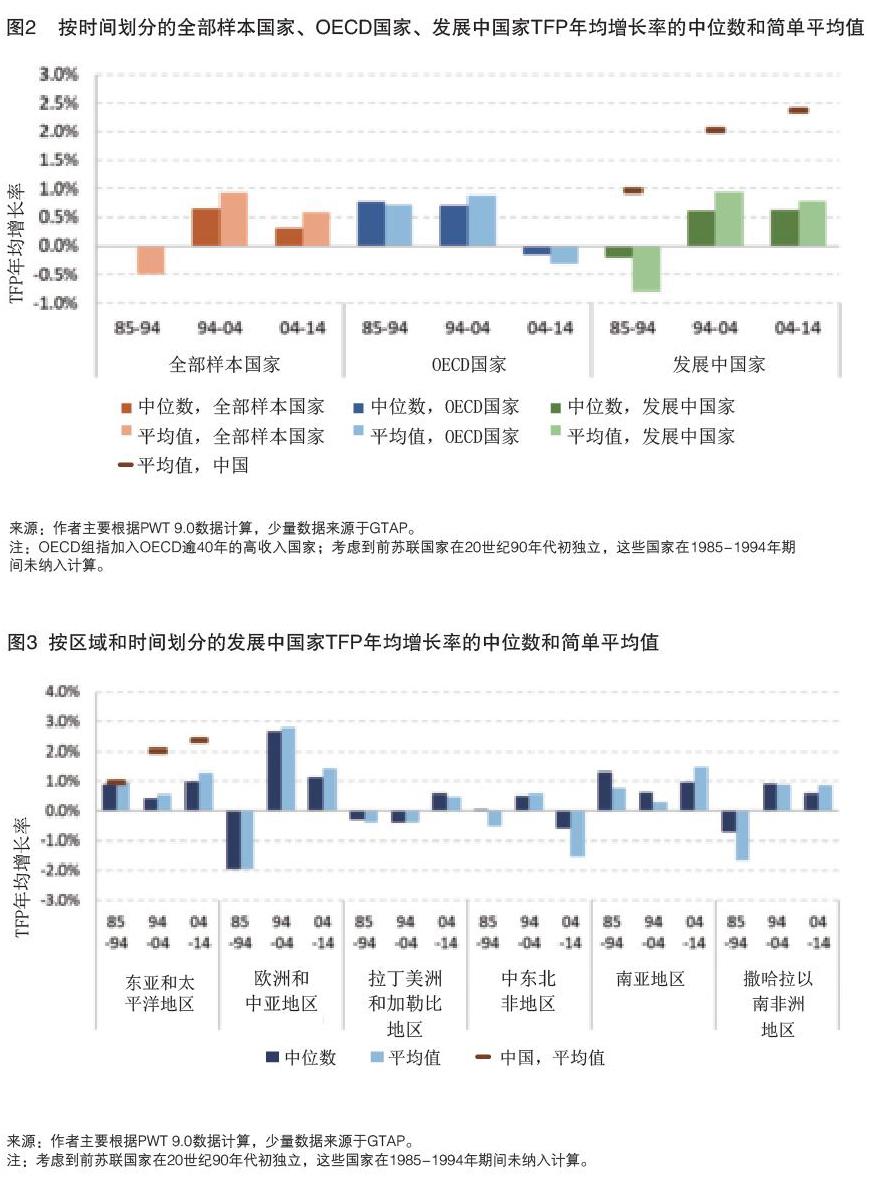
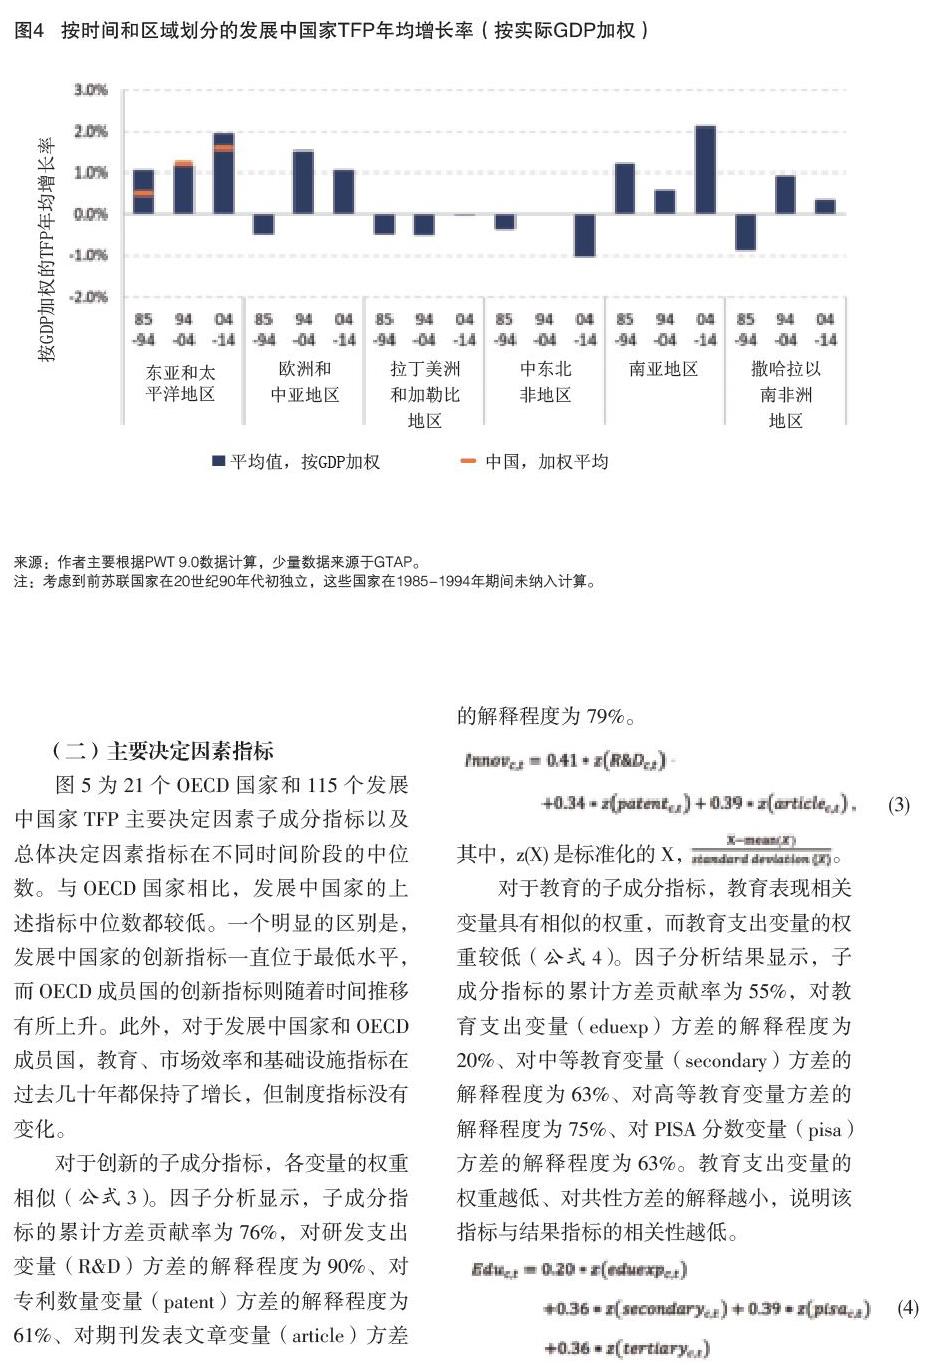
從圖2可以看出,對(duì)于21個(gè)OECD成員國(guó)而言,1985-2004年TFP年均增長(zhǎng)率的中位數(shù)和(簡(jiǎn)單)平均值均為正值,2005-2014年則下降至0以下;而在93個(gè)發(fā)展中國(guó)家中,1985-1994年TFP年均增長(zhǎng)率的中位數(shù)和(簡(jiǎn)單)平均值為負(fù)值,1995-2014年上升至0以上。圖3展示了按區(qū)域劃分的發(fā)展中國(guó)家TFP年均增長(zhǎng)率的中位數(shù)和(簡(jiǎn)單)平均值。在東亞和太平洋地區(qū),過(guò)去30年的TFP增長(zhǎng)率為正,在0.4%至1.3%之間。在歐洲和中亞地區(qū),1985-1994年TFP增長(zhǎng)率為負(fù),在1995-2004年上升至2%以上,在2005-2014年下降至1.2%左右。拉丁美洲和加勒比地區(qū)的TFP增長(zhǎng)率從1985-2004年的-0.4%左右上升至2005-2014年的0.5%左右。在中東北非地區(qū),TFP增長(zhǎng)率從1985-1994年的接近于0或負(fù)增長(zhǎng)上升至1995-2004年的0.5%左右,2005-2014年再次下滑至-0.5%左右。南亞地區(qū)過(guò)去30年的TFP增長(zhǎng)率為正值,在0.3%至1.5%之間。在撒哈拉以南非洲地區(qū),TFP增長(zhǎng)率從1985-1994年的-1%左右上升至1994-2014年的1%。圖4展示了根據(jù)GDP加權(quán)的區(qū)域TFP平均增長(zhǎng)率(世界銀行,2017d),其趨勢(shì)與圖3中未加權(quán)平均增長(zhǎng)率的趨勢(shì)相似。
(二)主要決定因素指標(biāo)
圖5為21個(gè)OECD國(guó)家和115個(gè)發(fā)展中國(guó)家TFP主要決定因素子成分指標(biāo)以及總體決定因素指標(biāo)在不同時(shí)間階段的中位數(shù)。與OECD國(guó)家相比,發(fā)展中國(guó)家的上述指標(biāo)中位數(shù)都較低。一個(gè)明顯的區(qū)別是,發(fā)展中國(guó)家的創(chuàng)新指標(biāo)一直位于最低水平,而OECD成員國(guó)的創(chuàng)新指標(biāo)則隨著時(shí)間推移有所上升。此外,對(duì)于發(fā)展中國(guó)家和OECD成員國(guó),教育、市場(chǎng)效率和基礎(chǔ)設(shè)施指標(biāo)在過(guò)去幾十年都保持了增長(zhǎng),但制度指標(biāo)沒(méi)有變化。
(三)主要決定因素指標(biāo)與TFP增長(zhǎng)之間的關(guān)系
1.主要決定因素指標(biāo)對(duì)TFP增長(zhǎng)方差的相對(duì)貢獻(xiàn)。圖6展示了全部樣本國(guó)家、OECD國(guó)家和發(fā)展中國(guó)家的各項(xiàng)TFP決定因素指標(biāo)對(duì)TFP增長(zhǎng)貢獻(xiàn)率的方差分解(控制了5年滯后期TFP水平和時(shí)間效應(yīng))。對(duì)于OECD國(guó)家,一個(gè)值得關(guān)注的趨勢(shì)是,市場(chǎng)效率指標(biāo)對(duì)TFP增長(zhǎng)率的貢獻(xiàn)上升,在過(guò)去10年對(duì)TFP增長(zhǎng)率方差的解釋程度為45%;而基礎(chǔ)設(shè)施指標(biāo)的貢獻(xiàn)呈下降趨勢(shì)且對(duì)TFP增長(zhǎng)率方差的解釋程度最小。對(duì)于發(fā)展中國(guó)家,1985-1994年期間TFP決定因素對(duì)TFP增長(zhǎng)率方差解釋力最高的指標(biāo)是制度,但其貢獻(xiàn)率隨后有所下降。在過(guò)去20年里,教育指標(biāo)對(duì)TFP增長(zhǎng)的貢獻(xiàn)有所上升,其對(duì)TFP增長(zhǎng)率方差的解釋程度在過(guò)去10年接近50%。
方差分解分析有助于理解各國(guó)TFP增長(zhǎng)差異的驅(qū)動(dòng)因素。但是,該分析并沒(méi)有說(shuō)明對(duì)于特定國(guó)家而言,什么才是驅(qū)動(dòng)TFP增長(zhǎng)最重要或最關(guān)鍵的因素。為此,我們需要對(duì)TFP的各項(xiàng)決定因素進(jìn)行國(guó)別比較。我們?cè)诘?部分討論了有關(guān)模擬和情境分析的結(jié)果。但在此之前,我們還需要對(duì)總體決定因素指標(biāo)對(duì)TFP增長(zhǎng)的影響進(jìn)行合理的估計(jì)。
2.總體決定因素指標(biāo)與TFP增長(zhǎng)率之間的關(guān)系。表1給出了公式2的回歸結(jié)果,其中TFP增長(zhǎng)率是關(guān)于滯后期總體決定因素指標(biāo)和滯后期TFP水平的函數(shù)(考慮了國(guó)別效應(yīng)和時(shí)間效應(yīng))。我們沒(méi)有嘗試將五個(gè)子成分指標(biāo)作為單獨(dú)的變量進(jìn)行回歸,因?yàn)樗鼈冎g的相關(guān)性非常高,且其估計(jì)邊際效應(yīng)會(huì)受到多重共線性的影響。
如表1所示,滯后期總體決定因素指標(biāo)和滯后期TFP水平在所有回歸中(無(wú)國(guó)別效應(yīng)、隨機(jī)國(guó)別效應(yīng)和固定國(guó)別效應(yīng))都在統(tǒng)計(jì)學(xué)上顯著。根據(jù)Hausman檢驗(yàn),如果不考慮相互的國(guó)別效應(yīng)可能會(huì)存在估計(jì)偏差,我們選擇具有固定國(guó)別效應(yīng)(相關(guān)但不隨機(jī))的回歸。
在固定效應(yīng)模型中,在控制了滯后期TFP水平和國(guó)別效應(yīng)、時(shí)間效應(yīng)后,滯后期總體決定因素指標(biāo)每提高1個(gè)百分點(diǎn),TFP年均增長(zhǎng)率提高0.05個(gè)百分點(diǎn)。由于函數(shù)收斂,在其他變量保持不變的情況下,滯后期TFP每增長(zhǎng)1個(gè)百分點(diǎn),TFP年均增長(zhǎng)率下降0.10個(gè)百分點(diǎn)。這意味著TFP水平較高的國(guó)家需要比那些TFP水平較低的國(guó)家在各項(xiàng)決定因素指標(biāo)上有更多的提升,以實(shí)現(xiàn)相同的TFP增長(zhǎng)率。滯后3年和滯后7年的回歸結(jié)果在符號(hào)和顯著性上都是穩(wěn)健的。當(dāng)我們使用WDI數(shù)據(jù)庫(kù)來(lái)構(gòu)建TFP水平和增長(zhǎng)率指標(biāo),結(jié)果同樣是穩(wěn)健的。
五、模擬和情境分析
(一)按區(qū)域和收入水平劃分的國(guó)家組別
在本章中,我們模擬了78個(gè)中低收入發(fā)展中國(guó)家(即2014年人均GDP低于12,056美元的國(guó)家,以2010不變價(jià)美元計(jì)算)的TFP增長(zhǎng)率變化。我們給出了按區(qū)域或收入水平分類的模擬結(jié)果。在更廣泛的意義上,長(zhǎng)期增長(zhǎng)模型(LTGM)工具包可以用于為更多國(guó)家預(yù)測(cè)TFP增長(zhǎng)率。LTGM的使用者能夠?qū)FP增長(zhǎng)的外生路徑的假設(shè)替換為由創(chuàng)新、教育、市場(chǎng)效率、基礎(chǔ)設(shè)施、制度改善組成的總體決定因素指標(biāo)。
本文提供了4種情境分析,并給出了提高TFP決定因素指標(biāo)至區(qū)域或世界基準(zhǔn)(或領(lǐng)先水平)的不同方式和程度。我們使用固定效應(yīng)回歸結(jié)果將TFP增長(zhǎng)的變化與總體決定因素指標(biāo)的變化聯(lián)系起來(lái)。TFP的相應(yīng)增長(zhǎng)直接取決于一國(guó)TFP決定因素的改善速度,而與過(guò)去TFP的改善程度成反方向變化。因此,在那些TFP決定因素指標(biāo)與基準(zhǔn)水平存在較大差距的國(guó)家,如果能夠推動(dòng)決定因素的改革,其TFP將會(huì)出現(xiàn)更大的增長(zhǎng)。反過(guò)來(lái),過(guò)去TFP增長(zhǎng)較快的國(guó)家會(huì)面臨TFP增速放緩的問(wèn)題。改善TFP決定因素的積極影響以及過(guò)去TFP表現(xiàn)的負(fù)面影響相疊加,就構(gòu)成了一個(gè)有趣的、非線性的TFP增長(zhǎng)預(yù)測(cè)路徑:在大多數(shù)情況下,TFP的增長(zhǎng)路徑是一個(gè)凸函數(shù),即以邊際遞減的速度增長(zhǎng),在達(dá)到最大之后開(kāi)始下降或保持穩(wěn)定。由于在模擬中改進(jìn)TFP決定因素的改革并非立即進(jìn)行,而是隨著時(shí)間推移逐步推進(jìn)的(在兩種情境中,模仿基準(zhǔn)國(guó)家過(guò)去30年的實(shí)際軌跡),預(yù)測(cè)的TFP增長(zhǎng)路徑有一個(gè)額外的凸性來(lái)源,因?yàn)門FP決定因素指標(biāo)的增長(zhǎng)率會(huì)隨著時(shí)間趨于下降。
1.情境I:TFP決定因素改善至區(qū)域內(nèi)最高水平。情境I假設(shè)一國(guó)將其TFP總體決定因素指標(biāo)提高至區(qū)域內(nèi)發(fā)展中國(guó)家(非OECD成員國(guó))的最高水平。我們假定一國(guó)TFP總體決定因素指標(biāo)從初始值(2014年)開(kāi)始以恒定的速度增長(zhǎng),經(jīng)過(guò)15年達(dá)到基準(zhǔn)國(guó)家的當(dāng)前水平,并在其后繼續(xù)以相同的速度增長(zhǎng)(見(jiàn)表2)。
圖7描繪了情境I中的TFP平均增長(zhǎng)率。對(duì)于東亞和太平洋地區(qū),1985-2014年期間其TFP平均增長(zhǎng)率是各區(qū)域的歷史最高點(diǎn),預(yù)計(jì)TFP平均增長(zhǎng)率將在未來(lái)12年上升至2.5%,隨后逐漸下降。在撒哈拉以南非洲地區(qū),預(yù)計(jì)TFP平均增長(zhǎng)率將在未來(lái)15年上升至1.9%,這一增幅是所有地區(qū)在過(guò)去相應(yīng)TFP增速水平上所達(dá)到的最大增幅。在歐洲和東亞地區(qū)、拉丁美洲和加勒比地區(qū)以及中東北非地區(qū),模擬的TFP平均增長(zhǎng)率相似,在未來(lái)23年增長(zhǎng)到近1%,隨后逐漸下降。在南亞地區(qū),TFP平均增長(zhǎng)率維持在0.6%-0.8%的區(qū)間內(nèi)。按區(qū)域基準(zhǔn)國(guó)家的水平進(jìn)行估算,在一定程度上限制了一國(guó)TFP增長(zhǎng)取得進(jìn)展的可能性,因?yàn)閰^(qū)域基準(zhǔn)國(guó)家自身可能并不是最領(lǐng)先的,例如南亞地區(qū)的印度。
2.情境II:遵循區(qū)域內(nèi)TFP總體決定因素指標(biāo)改善幅度最大的軌跡。情境II假設(shè)一國(guó)復(fù)制了過(guò)去30年區(qū)域基準(zhǔn)國(guó)家TFP總體決定因素指標(biāo)的年度增長(zhǎng)軌跡。如表3所示,情境II中的區(qū)域基準(zhǔn)國(guó)家是指在1985-2014年期間TFP總體決定因素指標(biāo)增幅最大的國(guó)家(與區(qū)域內(nèi)所有發(fā)展中國(guó)家相比)。
我們將基準(zhǔn)國(guó)家1985-2014年期間TFP總體決定因素指標(biāo)年均變化率應(yīng)用于同一區(qū)域所有國(guó)家,以2014年作為初期估算未來(lái)30年的TFP增長(zhǎng)路徑,并以2005-2014年的年均變化率估算后續(xù)年份的TFP增長(zhǎng)路徑。
圖8反映了情境Ⅱ的TFP平均增長(zhǎng)率預(yù)測(cè)值。在東亞和太平洋地區(qū),從1985-2014年歷史最高TFP年均增長(zhǎng)率開(kāi)始,預(yù)計(jì)在未來(lái)15年TFP年均增長(zhǎng)率將上升至1.7%,隨后有所下降。在拉丁美洲和加勒比地區(qū)以及撒哈拉以南非洲地區(qū),預(yù)計(jì)未來(lái)30多年的TFP年均增長(zhǎng)率分別上升至0.9%和1.2%。歐洲和中亞地區(qū)以及中東北非地區(qū)的TFP年均增長(zhǎng)率預(yù)計(jì)在未來(lái)20年分別上升至0.7%和0.6%,隨后逐步下降。在南亞地區(qū),TFP增長(zhǎng)率預(yù)計(jì)保持在0.6%-0.9%的水平上。
3.情境Ⅲ:TFP決定因素指標(biāo)提高至所有發(fā)展中國(guó)家的最高水平。情境Ⅲ假設(shè)一國(guó)(發(fā)展中國(guó)家)將其TFP總體決定因素指標(biāo)提高至所有發(fā)展中國(guó)家的最高水平(2014年),即達(dá)到韓國(guó)的水平。假定一國(guó)TFP總體決定因素指標(biāo)在15年內(nèi)線性上升至韓國(guó)2014年的水平,并在此后繼續(xù)以同樣的增速增長(zhǎng)。
如圖9a所示,對(duì)于與基準(zhǔn)水平差距最大、TFP增長(zhǎng)率相對(duì)較低的撒哈拉以南非洲地區(qū),其TFP增長(zhǎng)率預(yù)計(jì)將在11年實(shí)現(xiàn)最大幅度的改善(與1985-2014年平均增幅相比),達(dá)到3.4%的水平,隨后有所下降。與撒哈拉以南非洲地區(qū)相似,南亞地區(qū)TFP增長(zhǎng)率預(yù)計(jì)將在11年內(nèi)上升至3.2%的水平,隨后開(kāi)始下降。TFP歷史平均增長(zhǎng)率最高的東亞和太平洋地區(qū),其TFP增長(zhǎng)率預(yù)計(jì)在11年內(nèi)上升至2.5%,是所有地區(qū)相較于歷史水平增幅最小的地區(qū),反映了該地區(qū)在過(guò)去保持著很高的TFP增長(zhǎng)率。拉丁美洲和加勒比地區(qū)以及中東北非地區(qū)在過(guò)去保持了負(fù)的TFP增長(zhǎng)率,預(yù)計(jì)未來(lái)15年這兩個(gè)地區(qū)的TFP平均增長(zhǎng)率將分別上升至2.2%和2.1%。在歐洲和中亞地區(qū),由于過(guò)去TFP也是負(fù)增長(zhǎng),預(yù)計(jì)其TFP平均增長(zhǎng)率將在16年內(nèi)上升至1.7%,隨后開(kāi)始下降。
我們進(jìn)一步按收入水平對(duì)樣本國(guó)家進(jìn)行了劃分,并得出了有趣的結(jié)論。圖9b顯示,低收入國(guó)家的TFP平均增長(zhǎng)率有望在11年內(nèi)提高至3.3%,中低收入國(guó)家在12年內(nèi)提高至2.6%,中高收入國(guó)家在16年內(nèi)提高至1.8%。在所有情況下,TFP增長(zhǎng)率都在達(dá)到峰值后出現(xiàn)下降,在35年內(nèi)達(dá)到1.5%左右的水平。這些結(jié)論進(jìn)一步佐證了按區(qū)域分類的結(jié)論:TFP決定因素指標(biāo)與基準(zhǔn)國(guó)家差距較大的國(guó)家、地區(qū)或國(guó)家組,如果能夠推動(dòng)相應(yīng)的改革,將會(huì)獲得更大的收益,并且TFP將出現(xiàn)大幅增長(zhǎng);對(duì)于那些TFP增長(zhǎng)率已經(jīng)很高或者TFP增幅很大的國(guó)家,TFP增長(zhǎng)率將趨于下降。
4.情境Ⅳ:遵循所有發(fā)展中國(guó)家TFP總體決定因素指標(biāo)改善幅度最大的路徑。情境Ⅳ假設(shè)一國(guó)復(fù)制了世界基準(zhǔn)國(guó)家的TFP年度變化軌跡。在所有發(fā)展中國(guó)家(非OECD成員國(guó))中,1985-2014年期間TFP總體決定因素指標(biāo)改善幅度最大的國(guó)家是韓國(guó)。我們將韓國(guó)1985-2014年期間TFP總體決定因素指標(biāo)年均變化率應(yīng)用于其他國(guó)家,以2014年作為初期估算未來(lái)30年的TFP增長(zhǎng)路徑,并以2005-2014年的年均變化率估算后續(xù)年份的TFP增長(zhǎng)路徑。
如圖10a所示,對(duì)于與基準(zhǔn)水平差距最大、TFP增長(zhǎng)率相對(duì)較低的撒哈拉以南非洲地區(qū),其TFP增長(zhǎng)率預(yù)計(jì)將在16年內(nèi)實(shí)現(xiàn)最大幅度的改善(與1985-2014年平均增幅相比),達(dá)到2.1%的水平。南亞地區(qū)TFP增長(zhǎng)率預(yù)計(jì)在16年內(nèi)提高至2.0%,此后開(kāi)始下降。在歷史平均增速最高的中亞和太平洋地區(qū),TFP平均增長(zhǎng)率預(yù)計(jì)在未來(lái)15年達(dá)到1.7%,在所有地區(qū)中增幅最小。過(guò)去TFP負(fù)增長(zhǎng)的拉丁美洲和加勒比地區(qū)、中東北非地區(qū)以及歐洲和中亞地區(qū),預(yù)計(jì)其TFP增長(zhǎng)率將在19-20年內(nèi)上升至1.2%-1.4%的水平。
圖10b為按收入分組的估算結(jié)果。低收入國(guó)家TFP平均增長(zhǎng)率提高幅度最大,預(yù)計(jì)在16年后達(dá)到2.0%,中低收入國(guó)家預(yù)計(jì)在17年后提高到1.7%,中高收入國(guó)家預(yù)計(jì)在20年后提高到1.2%。圖10的結(jié)果進(jìn)一步證明,對(duì)于撒哈拉以南非洲等與基準(zhǔn)水平具有較大差距的國(guó)家、區(qū)域或國(guó)家組,未來(lái)TFP將有更大的增長(zhǎng)潛力;而TFP增長(zhǎng)較快的國(guó)家或地區(qū),如東亞和太平洋地區(qū),后續(xù)TFP增速將放緩。
(二)中國(guó):國(guó)別分析
如前所述,LTGM工具包可以對(duì)各國(guó)不同情境下的TFP增長(zhǎng)路徑進(jìn)行模擬。作為案例,本文將其應(yīng)用于中國(guó)的兩種情境,見(jiàn)圖11。在每種情境中,我們假設(shè)到2050年TFP決定因素指標(biāo)的增長(zhǎng)路徑是給定的(圖11,左),從而得到同期TFP增長(zhǎng)路徑(圖11,右)。
一個(gè)重要影響因素是TFP增長(zhǎng)率的歷史水平,其不僅決定了TFP增長(zhǎng)的初始值,也決定了未來(lái)進(jìn)一步提高TFP增長(zhǎng)率的難度。對(duì)于中國(guó)而言,我們將TFP增長(zhǎng)率的歷史水平設(shè)定為可以獲得數(shù)據(jù)的最近5年(2010-2014年)的平均水平。其他國(guó)家進(jìn)行情境模擬時(shí)也可以采用類似的分析和選擇。
在情境Ⅰ中,我們假設(shè)中國(guó)TFP總體決定因素指標(biāo)達(dá)到所有發(fā)展中國(guó)家的最高水平(即韓國(guó))。我們分析了兩種可能,分別是在15年(圖11,上圖橙色線條)和30年(圖11,上圖綠色線條)達(dá)到韓國(guó)的水平。這兩種情況都背離了過(guò)去的趨勢(shì),橙色線條表現(xiàn)尤為明顯。TFP增長(zhǎng)所帶來(lái)的收益也很大:在快速改善的案例中,TFP增長(zhǎng)率在5年內(nèi)從1.2%上升至1.6%,在10年內(nèi)達(dá)到1.9%,隨后逐漸下降,到2050年下降至1.3%左右。情境Ⅰ代表著TFP增長(zhǎng)得到持續(xù)、快速的根本性改善。情境Ⅱ則代表了一個(gè)更為緩和、但更容易實(shí)現(xiàn)的可能。
在情境Ⅱ中,假設(shè)中國(guó)TFP總體決定因素指標(biāo)變化遵循1985-2014年改善幅度最大國(guó)家(韓國(guó))的軌跡,并保持這一趨勢(shì)(圖11,下圖綠色線條)。那么,中國(guó)TFP增長(zhǎng)率將在13年內(nèi)從1.2%上升至1.4%,并逐漸下降至2050年的1%左右。
與世界上大多數(shù)國(guó)家一樣,持續(xù)的TFP增長(zhǎng)對(duì)于中國(guó)經(jīng)濟(jì)增長(zhǎng)至關(guān)重要。但TFP增長(zhǎng)本身并不能作為高速經(jīng)濟(jì)增長(zhǎng)目標(biāo)的支撐。高速經(jīng)濟(jì)增長(zhǎng)必須伴隨著在物質(zhì)資本積累、勞動(dòng)力參與數(shù)量和質(zhì)量以及國(guó)內(nèi)儲(chǔ)蓄等方面的努力。
六、結(jié)論
本文是世界銀行長(zhǎng)期增長(zhǎng)模型(LTGM)TFP模塊的背景研究。本文為世界上大多數(shù)發(fā)展中國(guó)家提供了預(yù)測(cè)其未來(lái)TFP增長(zhǎng)路徑的方法,當(dāng)然前提是這些國(guó)家遵循相應(yīng)的改革計(jì)劃以達(dá)到區(qū)域或全球領(lǐng)先國(guó)家的水平。
我們?cè)趯?duì)文獻(xiàn)進(jìn)行綜述的基礎(chǔ)上,選擇創(chuàng)新、教育、市場(chǎng)效率、基礎(chǔ)設(shè)施和制度作為五個(gè)TFP決定因素。對(duì)于每一個(gè)決定因素,我們使用因子分析方法構(gòu)建了相應(yīng)的指標(biāo),再使用主成分分析法將五個(gè)子成分指標(biāo)組合成一個(gè)總體指標(biāo)。
通過(guò)分析各子成分指標(biāo)對(duì)TFP增長(zhǎng)率方差的貢獻(xiàn),我們發(fā)現(xiàn),對(duì)于OECD國(guó)家而言,近10年市場(chǎng)效率對(duì)TFP增長(zhǎng)率方差的貢獻(xiàn)最大,基礎(chǔ)設(shè)施貢獻(xiàn)最小;對(duì)于發(fā)展中國(guó)家而言,教育的貢獻(xiàn)不斷上升,是近10年來(lái)最主要的決定因素。雖然這種方法不能作為政策改革的指導(dǎo),但它解釋了不同時(shí)期、不同發(fā)展階段TFP增長(zhǎng)為什么會(huì)出現(xiàn)差異。
我們的回歸分析表明,TFP總體決定因素指標(biāo)與TFP增長(zhǎng)率顯著相關(guān)(控制了初始TFP水平以及國(guó)別效應(yīng)和時(shí)間效應(yīng))。在那些TFP決定因素改善空間更大、改革力度更強(qiáng)的國(guó)家,TFP增長(zhǎng)率在短期內(nèi)將有較大提高。從長(zhǎng)期看,TFP增長(zhǎng)達(dá)到峰值后會(huì)開(kāi)始放緩。
從歷史水平來(lái)看,在重大改革的最優(yōu)情境中,TFP增長(zhǎng)幅度預(yù)計(jì)在2.5-3個(gè)百分點(diǎn),這一增幅不足以支持過(guò)高的經(jīng)濟(jì)增長(zhǎng)目標(biāo)。在提高生產(chǎn)率的同時(shí),儲(chǔ)蓄、投資、勞動(dòng)力、人力資本形成應(yīng)繼續(xù)在各國(guó)的增長(zhǎng)和發(fā)展議程中占據(jù)重要地位。
當(dāng)然,本文的研究難免有一些不足之處,在解釋結(jié)果時(shí)應(yīng)加以考慮。一個(gè)問(wèn)題是TFP決定因素可能是TFP增長(zhǎng)的內(nèi)生變量。為了解決內(nèi)生性問(wèn)題,我們?cè)诜讲罘纸夂突貧w分析中使用了TFP決定因素指標(biāo)的滯后觀測(cè)值。這種方法可能比工具變量更好(Young,2017)。另一個(gè)問(wèn)題是我們沒(méi)有將生產(chǎn)率的所有決定因素都納入在內(nèi),無(wú)論是一級(jí)指標(biāo)還是二級(jí)指標(biāo)。例如,我們沒(méi)有考慮地理?xiàng)l件、勞動(dòng)力人口、收入和財(cái)富不平等或者企業(yè)家精神和管理能力等因素(Feyrer, 2007; Mastromarco and Zago, 2012; Kremer, Rao and Schilbach, 2019)。為此,我們加入了國(guó)別效應(yīng)來(lái)解決這個(gè)問(wèn)題,這是一種控制生產(chǎn)率決定因素的合理策略。此外,我們還納入了一些指標(biāo),這些指標(biāo)不僅體現(xiàn)了其狹義的定義,還代表了我們?cè)谘芯恐袥](méi)有涉及的更廣義的變量。第三個(gè)問(wèn)題涉及將生產(chǎn)率作為殘差的眾所周知的缺點(diǎn)。從某種意義上說(shuō),索洛剩余衡量的是“我們無(wú)法獲知的因素”(Abramovitz, 1956),不僅包括生產(chǎn)率,還包括其他很多變量,如過(guò)剩產(chǎn)能、自然資源、異質(zhì)性、無(wú)形資本等(Hulten, 2001; Corrado, Hulten and Sichel, 2009)。但我們認(rèn)為,關(guān)注一段時(shí)期TFP平均增長(zhǎng)率(而不是TFP水平或TFP增長(zhǎng)率波動(dòng)),有助于解釋TFP增長(zhǎng)(Jorgenson and Griliches, 1967)。第四個(gè)問(wèn)題是我們的研究側(cè)重于全球模式,沒(méi)有充分考慮到國(guó)家的異質(zhì)性。TFP決定因素指標(biāo)對(duì)TFP增長(zhǎng)方差的相對(duì)貢獻(xiàn)以及總體決定因素指標(biāo)對(duì)TFP增長(zhǎng)的影響,可能因國(guó)家和區(qū)域不同而存在差異,主要原因是經(jīng)濟(jì)發(fā)展水平和政治社會(huì)環(huán)境有所不同。盡管存在上述不足之處,我們希望本文及附帶的工具包可以成為研究人員和決策者分析特定國(guó)家生產(chǎn)率和增長(zhǎng)的起點(diǎn)。
參考文獻(xiàn)
[1]Abdih, Yasser, and Frederick Joutz. 2006. “Relating the Knowledge Production Function to Total Factor Productivity: An Endogenous Growth Puzzle.”WP/05/74. IMF Working Paper.
[2]Abramovitz, M. 1956. “Resource and Output Trends in the United States since 1870.”AmericanEconomic Review 46: 5-23.
[3]Acemoglu, Daron, Simon Johnson, and James Robinson. 2004. “Institutions as the Fundamental Cause of Long-Run Growth.” 10481. NBER Working Paper.
[4]Acemoglu, Daron, Simon Johnson, and James A. Robinson. 2001. “The Colonial Origins of Comparative Development: An Empirical Investigation.” American Economic Review 91 (5): 1369–1401. https://doi.org/10.1257/aer.91.5.1369.
[5]Aghion, Philippe, and Howitt. 1992. “A Model of Growth through Creative Destruction.”Econometrica 60 (2): 323–51. https://doi.org/10.2307/2951599.
[6]Aguiar, Angel, Badri Narayanan, and Robert McDougall. 2016. “An Overview of the GTAP 9 Data Base.” Journal of Global Economic Analysis 1 (1): 181–208. https://doi.org/10.21642/JGEA.010103AF.
[7]Alfaro, Laura, Areendam Chanda, SebnemKalemli-Ozcan, and Selin Sayek. 2004. “FDI and Economic Growth: The Role of Local Financial Markets.” Journal of International Economics 64 (1): 89–112. https://doi.org/10.1016/S0022-1996(03)00081-3.
[8]Alfaro, Laura, SebnemKalemli-Ozcan, and Selin Sayek. 2009. “FDI, Productivity and Financial Development.” World Economy 32 (1): 111–35. https://doi.org/10.1111/j.1467-9701.2009.01159.x.
[9]Ark, Bart van, Mary OMahony, and Marcel P Timmer. 2008. “The Productivity Gap between Europe and the United States: Trends and Causes.” Journal of Economic Perspectives 22 (1): 25–44. https://doi.org/10.1257/jep.22.1.25.
[10]Arnold, Jens, Giuseppe Nicoletti, and Stefano Scarpetta. 2008. “Regulation, Allocative Efficiency and Productivity in OECD Countries.” OECD Economics Department Working Papers. https://doi.org/10.1787/241447806226.
[11]Aschauer, David Alan. 1989. “Is Public Expenditure Productive?” Journal of Monetary Economics 23 (2): 177–200. https://doi.org/10.1016/0304-3932(89)90047-0.
[12]Azen, Razia, and David V Budescu. 2003. “The Dominance Analysis Approach for Comparing Predictors in Multiple Regression.” Psychological Methods 8 (2): 129–48. https://doi.org/10.1037/1082-989X.8.2.129.
[13]Barro, Robert J., and Jong Wha Lee. 2013. “A New Data Set of Educational Attainment in the World, 1950-2010.” Journal of Development Economics 104: 184–98. https://doi.org/10.1016/j.jdeveco.2012.10.001.
[14]Barro, Robert J., and Xavier Sala-I-Martin. 1992. “Public Finance in Models of Economic Growth.” The Review of Economic Studies 59 (4): 645. https://doi.org/10.2307/2297991.
[15]Barro, Robert J., and Xavier I. Sala-i-Martin. 2004. “Capter 10. Growth Accounting.” In Economic Growth, 2nd ed. Cambridge, Massachusetts: The MIT Press.
[16]Barro, Robert J. 1990. “Government Spending in a Simple Model of Endogeneous Growth.” Journal of Political Economy 98 (5): S103–25. https://doi.org/10.1086/261726.
[17]———. 1991. “Economic Growth in a Cross-Section of Countries.” The Quarterly Journal of Economics 106 (2): 407–43. https://doi.org/10.2307/2937943.
[18]———. 2001. “Human Capital and Growth.” The American Economic Review 91 (2): 12–17. https://doi.org/10.2307/2677725.
[19]Bartelsman, Eric J., Pieter A. Gautier, and Joris De Wind. 2016. “Employment Protection, Technology Choice, and Worker Allocation.” International Economic Review 57 (3): 787–826. https://doi.org/10.1111/iere.12176.
[20]Beck, Thorsten, Ross Levine, and Norman Loayza. 2000. “Finance and the Sources of Growth.” Journal of Financial Economics 58 (1–2): 261–300. https://doi.org/10.1016/S0304-405X(00)00072-6.
[21]Ben-David, Dan, and David H. Papell. 1998. “Slowdowns and Meltdowns: Postwar Growth Evidence from 74 Countries.” Review of Economics and Statistics 80 (4): 561–71. https://doi.org/10.1162/003465398557834.
[22]Benhabib, J., and Mark M. Spiegel. 2005. “Chapter 13 Human Capital and Technology Diffusion.” Handbook of Economic Growth. https://doi.org/10.1016/S1574-0684(05)01013-0.
[23]Benhabib, J, and M Spiegel. 1994. “The Role of Human Capital in Economic Development. Evidence from Aggregate Cross-Country Data.” Journal of Monetary Economics 144: 117–43. https://doi.org/10.1016/0304-3932(94)90047-7.
[24]Benhabib, Jess, and M.M. Spiegel. 1994. “The Role of Human Capital in Economic Development Evidence from Aggregate Cross-Country Data.” Journal of Monetary Economics 34 (2): 143–173. https://doi.org/http://dx.doi.org/10.1016/0304-3932(94)90047-7.
[25]Benhabib, Jess, and Mark M Spiegel. 2005. “Human Capital and Technology Diffusion.” In Handbook of Economic Growth, 1:936–65. https://doi.org/10.1016/S1574-0684(05)01013-0.
[26]Bergoeing, Raphael, Norman V. Loayza, and Facundo Piguillem. 2016. “The Whole Is Greater than the Sum of Its Parts: Complementary Reforms to Address Microeconomic Distortions.” World Bank Economic Review 30 (2): 268–305. https://doi.org/10.1093/wber/lhv052.
[27]Borensztein, E., J. De Gregorio, and J-W. Lee. 1998. “How Does Foreign Direct Investment Affect Economic Growth?” Journal of International Economics 45 (1): 115–35. https://doi.org/10.1016/S0022-1996(97)00033-0.
[28]Bridgman, Benjamin, Shi Qi, and James A. Schmitz. 2009. “The Economic Performance of Cartels: Evidence from the New Deal U.S. Sugar Manufacturing Cartel, 1934–74.” 437. Federal Reserve Bank of Minneapolis Staff Report.
[29]Bronzini, Raffaello, and Paolo Piselli. 2009. “Determinants of Long-Run Regional Productivity with Geographical Spillovers: The Role of R&D, Human Capital and Public Infrastructure.” Regional Science and Urban Economics 39 (2): 187–99. https://doi.org/10.1016/j.regsciurbeco.2008.07.002.
[30]Budescu, David V. 1993. “Dominance Analysis: A New Approach to the Problem of Relative Importance of Predictors in Multiple Regression.” Psychological Bulletin. https://doi.org/10.1037/0033-2909.114.3.542.
[31]Buera, Francisco J, Joseph P Kaboski, and Yongseok Shin. 2011. “American Economic Association Finance and Development: A Tale of Two Sectors.” The American Economic Review 101 (5): 1964–2002. https://doi.org/10.1257/aer.
[32]Caballero, and Hammour. 1998. “Jobless Growth: Appropriability, Factor Substitution, and Unemployment.” Carnegie-Rochester Conference Series on Public Policy 48: 95–99. https://doi.org/http://dx.doi.org/10.1016/S0167-2231(98)00016-5.
[33]Caballero, R. J., and M. L. Hammour. 1996. “On the Timing and Efficiency of Creative Destruction.” The Quarterly Journal of Economics 111 (3): 805–52. https://doi.org/10.2307/2946673.
[34]Calderón, César, and Luis Servén. 2010. “Infrastructure and Economic Development in Sub-Saharan Africa.” Journal of African Economies 19 (Supplement 1): i13–87. https://doi.org/10.1093/jae/ejp022.
[35]———. 2012. “Infrastructure in Latin America. ”The Oxford Handbook of Latin American Economics. https://doi.org/10.1093/oxfordhb/9780199571048.013.0026.
[36]———. 2014. “Infrastructure, Growth, and Inequality: An Overview.” ?World Bank Policy Research Working Paper. https://doi.org/10.1596/1813-9450-7034.
[37]Canning, David, and Peter Pedroni. 2008. “Infrastructure, Long-Run Economic Growth and Causality Tests for Cointegrated Panels.” Manchester School 76 (5): 504–27. https://doi.org/10.1111/j.1467-9957.2008.01073.x.
[38]Caselli, Francesco. 2005. “Chapter 9 Accounting for Cross-Country Income Differences.” Handbook of Economic Growth. https://doi.org/10.1016/S1574-0684(05)01009-9.
[39]Centre for Economic Performance. 2017. “World Management Survey.” 2017.
[40]Céspedes, N., N. Loayza, and N. Ramírez.“Economic Growth in Peru: Causes and Consequences [in Spanish]. ”Lima: Fondo Editorial de la Universidad del Pacífico (forthcoming).
[41]Chanda, Areendam, and Carl Johan Dalgaard. 2008. “Dual Economies and International Total Factor Productivity Differences: Channelling the Impact from Institutions, Trade, and Geography.”Economica 75 (300): 629–61. https://doi.org/10.1111/j.1468-0335.2007.00673.x.
[42]Chang, Roberto, Linda Kaltani, and Norman V. Loayza. 2009. “Openness Can Be Good for Growth: The Role of Policy Complementarities.” Journal of Development Economics 90 (1): 33–49. https://doi.org/10.1016/j.jdeveco.2008.06.011.
[43]Chen, Derek H C, and Carl J Dahlman. 2004. “Knowledge and Development A Cross-Section Approach.” 3366. World Bank Policy Research Working Paper.
[44]Chenery, Hollis B. 1960. “Patterns of Industrial Growth.” The American Economic Review 50 (4): 624–54. https://doi.org/10.1257/jep.6.3.79.
[45]Cingano, Federico. 2014. “Trends in Income Inequality and Its Impact on Economic Growth.” OECD Social, Employment, and Migration Working Papers, no. 163: 0_1,5-59. https://doi.org/http://dx.doi.org/10.1787/5jxrjncwxv6j-en.
[46]Cirera, Xavier, and William F. Maloney. 2017. “The Innovation Paradox : Developing-Country Capabilities and the Unrealized Promise of Technological Catch-Up.” Washington, DC: World Bank. https://openknowledge.worldbank.org/handle/10986/28341.
[47]Coe, David T., Elhanan Helpman, and Alexander W. Hoffmaister. 2009. “International R&D Spillovers and Institutions.” European Economic Review 53 (7): 723–41. https://doi.org/10.1016/j.euroecorev.2009.02.005.
[48]Coe, David T, and Elhanan Helpman. 1995. “International R&D Spillovers.” European Economic Review 39 (5): 859–87. https://doi.org/10.1016/0014-2921(94)00100-E.
[49]Coe, David Theodore, Elhanan Helpman, and Alexander W. Hoffmaister. 1997. “North-South R&D Spillovers.” Economic Journal 107 (440): 134–49. https://doi.org/10.1111/1468-0297.00146.
[50]Comin, Diego, and Bart Hobijn. 2010. “An Exploration of Technology Diffusion.” American Economic Review 100 (5): 2031–59. https://doi.org/10.1257/aer.100.5.2031.
[51]Comin, Diego, Bart Hobijn, and Emilie Rovito. 2008. “Technology Usage Lags.” Journal of Economic Growth 13 (4): 237–56. https://doi.org/10.1007/s10887-008-9035-5.
[52]Comin, Diego, and MartíMestieri. 2018. “If Technology Has Arrived Everywhere, Why Has Income Diverged?” American Economic Journal: Macroeconomics 10 (3): 137–78. https://doi.org/10.1257/mac.20150175.
[53]Corrado, C., C. Hulten, and D. Sichel. “Intangible Capital and U.S. Economic Growth.” The Review of Income and Wealth 55(3): 661-685.
[54]Dabla-norris, Era, and Kalpana Kochhar. 2015. “Causes and Consequences of Income Inequality : A Global Perspective.” IMF Staff Discussion Note. https://doi.org/DOI:
[55]Dar, Atul A., and Sal AmirKhalkhali. 2002. “Government Size, Factor Accumulation, and Economic Growth: Evidence from OECD Countries.” Journal of Policy Modeling 24 (7–8): 679–92. https://doi.org/10.1016/S0161-8938(02)00163-1.
[56]Daron Acemoglu, And, and Fabrizio Zilibotti. 2001. “Productivity Differences.” Quarterly Journal of Economics 116 (2): 563–606. https://doi.org/10.1162/00335530151144104.
[57]Davis, Steven J., John Haltiwanger, and Scott Schuh. 1996. “Small Business and Job Creation: Dissecting the Myth and Reassessing the Facts.” Small Business Economics 8 (4): 297–315. https://doi.org/10.1007/BF00393278.
[58]Devadas, Sharmila, and Steven Michael Pennings. 2018. “Assessing the Effect of Public Capital on Growth: An Extension of the World Bank Long-Term Growth Model.” World Bank Policy Research Working Paper, No. 8604.
[59]Djankov, Simeon, Rafael La Porta, Florencio Lopez-de-Silanes, and Andrei Shleifer. 2002. “The Regulation of Entry.” The Quarterly Journal of Economics 117 (1): 1–37.
[60]Dollar, David, and Aart Kraay. 2004. “Trade, Growth, and Poverty.” The Economic Journal 114 (493): F22–49. https://doi.org/10.1111/j.0013-0133.2004.00186.x.
[61]Easterly, William. 2001. “The Middle Class Consensus and Economic Development.” Journal of Economic Growth 6 (4): 317–35. https://doi.org/10.1023/A:1012786330095.
[62]Easterly, William, and Ross Levine. 1997. “Africas Growth Tragedy.” The Quarterly Journal of Economics 112 (4): 1203–50. https://doi.org/10.1002/ps.3780.
[63]———. 2003. “Tropics, Germs, and Crops: How Endowments Influence Economic Development.” Journal of Monetary Economics. https://doi.org/10.1016/S0304-3932(02)00200-3.
[64]Easterly, William, and Ross E. Levine. 2001. “Its Not Factor Accumulation: Stylized Facts and Growth Models.” The World Bank Economic Review 15 (2): 177–219. https://doi.org/10.2139/ssrn.269108.
[65]Engerman, S, and Kenneth L. Sokoloff. 2000. “Institutions, Factor Endowments, and Paths of Development in the New World.” Journal of Economic Perspectives 14 (3): 217–32. http://scholar.google.com/scholar?hl=en&btnG=Search&q=intitle:Institutions+,+Factor+Endowments+,+and+Paths+of+Development+in+the+New+World#1.
[66]Erosa, Andrés, Tatyana Koreshkova, and Diego Restuccia. 2010. “How Important Is Human Capital? A Quantitative Theory Assessment of World Income Inequality.” Review of Economic Studies 77 (4): 1421–49. https://doi.org/10.1111/j.1467-937X.2010.00610.x.
[67]Fagerberg, Jan. 2000. “Technological Progress, Structural Change and Productivity Growth: A Comparative Study.” Structural Change and Economic Dynamics 11 (4): 393–411. https://doi.org/10.1016/S0954-349X(00)00025-4.
[68]Feenstra, Robert C., Robert Inklaar, and Marcel P. Timmer. 2015. “The Next Generation of the Penn World Table.” American Economic Review 105 (10): 3150–82. https://doi.org/10.1257/aer.20130954.
[69]Feyrer, James. 2007. “Demographics and Productivity.” The Review of Economics and Statistics 89 (1): 100-109.
[70]Foster, L., Haltiwanger, J. C., & Krizan, C. J. 2001. “Aggregate Productivity Growth. Lessons from Microeconomic Evidence.” In New Developments in Productivity Analysis, pp 303-372. University of Chicago Press.
[71]Furman, Jeffrey L., and Richard Hayes. 2004. “Catching up or Standing Still? National Innovative Productivity among ‘follower Countries, 1978-1999.” Research Policy 33 (9): 1329–54. https://doi.org/10.1016/j.respol.2004.09.006.
[72]Galiani, Sebastian, Paul Gertler, and Ernesto Schargrodsky. 2005. “Water for Life: The Impact of the Privatization of Water Services on Child Mortality.” Journal of Political Economy 113 (1): 83–120. https://doi.org/10.1086/426041.
[73]Ghali, Khalifa H. 1999. “Government Size and Economic Growth: Evidence from a Multivariate Cointegration Analysis.” Applied Economics 31 (8): 975–87. https://doi.org/10.1080/000368499323698.
[74]Giavazzi, Francesco, and Guido Tabellini. 2005. “Economic and Political Liberalizations.” Journal of Monetary Economics 52 (7): 1297–1330. https://doi.org/10.1016/j.jmoneco.2005.05.002.
[75]Griffith, Rachel, Stephen Redding, and John Van Reenen. 2004. “Mapping the Two Faces of R&D: Productivity Growth in a Panel of OECD Industries.” The Review of Economics and Statistics 86 (4): 883–95. https://doi.org/10.1162/0034653043125194.
[76]Gr?mping, Ulrike. 2007. “Estimators of Relative Importance in Linear Regression Based on Variance Decomposition.” American Statistician 61 (2): 139–47. https://doi.org/10.1198/000313007X188252.
[77]Grossman, Gene M., and Elhanan Helpman. 1991. “Quality Ladders in the Theory of Growth.” The Review of Economic Studies 58 (1): 43. https://doi.org/10.2307/2298044.
[78]Guellec, Dominique, and B. van Pottelsberghe de la Potterie. 2004. “From R&D to Productivity Growth: Do the Institutional Settings and the Source of Funds of R&D Matter?” Oxford Bulletin of Economics and Statistics 66 (3): 353–78. https://doi.org/10.1111/j.1468-0084.2004.00083.x.
[79]Hall, Robert E, and Charles I Jones. 1999. “Why Do Some Countries Produce so Much More Outper per Worker than Others?”Quarterly Journal of Economics 114 (1): 83–116. https://doi.org/10.1162/003355399555954.
[80]Haltiwanger, John, Stefano Scarpetta, and Helena Schweiger. 2008. “Assessing Job Flows across Countries: The Role of Industry, Firm Size and Regulations.” 13920. NBER Working Paper. https://doi.org/10.1017/CBO9781107415324.004.
[81]Hanushek, Eric A., and Ludger Woessmann. 2015. “The Knowledge Capital of Nations: Education and the Economics of Growth. ”The MIT Press.
[82]Hicks, John. 1939. “Value and Capital. ”Edited by John Hicks. Oxford, United Kingdom: Clarendon Press.
[83]Hoeller, Peter, Isabelle Joumard, and Isabell Koske. 2014. “Reducing Income Inequality While Boosting Economic Growth: Can It Be Done? Evidence from OECD Countries.” The Singapore Economic Review 59 (01): 1450001. https://doi.org/10.1142/S0217590814500015.
[84]Hopenhayn, Hugo. 1992. “Entry, Exit, and Firm Dynamics in Long Run Equilibrium.” Econometrica 60 (5): 1127–50.
[85]Hopenhayn, Hugo, and Richard Rogerson. 1993. “Job Turnover and Policy Evaluation: A General Equilibrium Analysis.” Journal of Political Economy 101 (5): 915–38. https://doi.org/10.1086/261909.
[86]Hsieh, Chang-Tai, and Peter J. Klenow. 2009. “Misallocation and Manufacturing TFP in China and India.” Quarterly Journal of Economics 124 (4): 1403–48. https://doi.org/10.1162/qjec.2009.124.4.1403.
[87]Hulten, Charles R. 2001. “Total Factor Productivity: A Short Biography.” In New Developments in Productivity Analysis, edited by Charles R. Hulten, Edwin R. Dean, and Michael J. Harper. https://doi.org/10.1080/09535310701571828.
[88]Hulten, Charles R. 1996. “Infrastructure Capital and Economic Growth How Well You Use It May Be More Important Than How Much You Have.” ?NBER Research Working Paper. https://doi.org/10.3386/w5847.
[89]International Road Federation. 2017a. “Roads, Paved (% of Total Roads).” International Road Federation. 2017.
[90]———. 2017b. “Roads, Total Network (Km).” International Road Federation. 2017.
[91]Isaksson, A. 2007. “Determinants of Total Factor Productivity: A Literature Review.” Research and Statistics Branch, UNIDO. http://www.rrojasdatabank.info/87573_determinants_of_total_factor_productivity.pdf.
[92]Jerzmanowski, Micha. 2007. “Total Factor Productivity Differences: Appropriate Technology vs. Efficiency.” European Economic Review 51 (8): 2080–2110. https://doi.org/10.1016/j.euroecorev.2006.12.005.
[105]Loayza, Norman V.; Pennings, Steven. 2018. “The Long Term Growth Model.” World Bank: Washington D.C. 2018. http://www.worldbank.org/LTGM.
[106]Loayza, Norman V., and Rei Odawara. 2010. “Infrastructure and Economic Growth in Egypt.” World Bank Policy Research Working Paper. https://doi.org/10.1177/097493060900100105.
[107]Loayza, Norman V, Pablo Fajnzylber, and César Calderón. 2005. “Economic Growth in Latin America and the Caribbean : Stylized Facts, Explanations, and Forecasts. ”Washington, DC: World Bank.
[108]Loayza, Norman V, and Luis Servén. 2010. “Business Regulation and Economic Performance.” World Bank Publications, No. 2554.
[109]Lucas, Robert E. 1988. “On the Mechanics of Economic Development.” Journal of Monetary Economics 22 (1): 3–42. https://doi.org/10.1016/0304-3932(88)90168-7.
[110]Mastromarco, Camilla, and Angelo Zago. 2012. “On Modeling the Determinants of TFP Growth.” Structural Change and Economic Dynamics 23 (4): 373-382.
[111]Mauro, P. 1995. “Corruption and Growth.” The Quarterly Journal of Economics 110 (3): 681–712. https://doi.org/10.2307/2946696.
[112]Mello, L.R. de. 1999. “Foreign Direct Investment-Led Growth: Evidence from Time Series and Panel Data.” Oxford Economic Papers 51: 133–51. https://doi.org/10.1093/oep/51.1.133.
[113]Mendi, Pedro. 2007. “Trade in Disembodied Technology and Total Factor Productivity in OECD Countries.” Research Policy 36 (1): 121–33. https://doi.org/10.1016/j.respol.2006.09.028.
[114]Melitz, Marc J. 2003. "The Impact of Trade on Intra-Industry Reallocations and Aggregate Industry Productivity." Econometrica 71 (6): 1695-1725.
[115]Miller, Stephen M., and Mukti P. Upadhyay. 2000. “The Effects of Openness, Trade Orientation, and Human Capital on Total Factor Productivity.” Journal of Development Economics 63 (2): 399–423. https://doi.org/10.1016/S0304-3878(00)00112-7.
[116]Mulaik, Stanley A. 2009. “Foundations of Factor Analysis. ”2nd edition. Boca Raton: Taylor & Francis Group, LLC.
[117]Munnell, Alicia H. 1992. “Policy Watch: Infrastructure Investment and Economic Growth.” Journal of Economic Perspectives 6 (4): 189–98. https://doi.org/10.1257/jep.6.4.189.
[118]Nadiri, M. Ishaq. 1993. “Innovations and Technological Spillovers.”. NBER Working Paper. https://doi.org/10.3386/w4423.
[119]Nicoletti, Giuseppe, and Stefano Scarpetta. 2003. “Regulation, Productivity and Growth: OECD Evidence.” Economic Policy 18 (36): 9–72. https://doi.org/10.1111/1468-0327.00102.
[120]North, Douglas C. 1990. “Institutions, Institutional Change and Economic Performance.” Cambridge University Press. https://doi.org/10.1017/CBO9780511606892.012.
[121]North, Douglass C. 1990. “Institutions, Institutional Change, and Economic Performance.” Cambridge University Press 5 (1): 1–153. https://doi.org/10.2307/2234910.
[122]OECD/IEA. 2017. “Electricity Production (KWh).” OECD/IEA. 2017.
[123]OECD. 2016a. “PISA: Mean Performance on the Mathematics Scale.” 2016.
[124]———. 2016b. “PISA: Mean Performance on the Reading Scale.” 2016.
[125]———. 2016c. “PISA: Mean Performance on the Science Scale.”
[126]Oliner, Stephen D., Daniel E. Sichel, and Kevin J. Stiroh. 2008. “Explaining a Productive Decade.” Journal of Policy Modeling 30 (4): 633–73. https://doi.org/10.1016/j.jpolmod.2008.04.007.
[127]Parente, Stephen L., and Edward C Prescott. 2000. “Barriers to Riches.” The MIT Press.
[128]Peneder, Michael. 2003. “Industrial Structure and Aggregate Growth.” Structural Change and Economic Dynamics 14 (4): 427–48. https://doi.org/10.1016/S0954-349X(02)00052-8.
[129]Petrin, Amil, and Jagadeesh Sivadasan. 2011. “Estimating Lost Output from Allocative Inefficiency, with an Application to Chile and Firing Costs.” Review of Economics and Statistics 95 (1): 286–301. https://doi.org/10.1162/REST_a_00238.
[130]Pritchett, L. 1996. “Mind Your Ps and Qs: The Cost of Public Investment Is Not the Value of Public Capital.” World Bank Policy Research Working Paper. https://doi.org/10.1596/1813-9450-1660.
[131]Przeworski, Adam, and Fernando Limongi. 1993. “Political Regimes and Economic Growth.” Journal of Economic Perspectives 7 (3): 51–69. https://doi.org/10.1257/jep.7.3.51.
[132]Rajan, Raghuram G., and Luigi Zingales. 1998. “Financial Dependence and Growth.” American Economic Review 88 (3): 559–86.
[133]Rebelo, S. 1991. “Long-Run Policy Analysis and Long-Run Growth.” Journal of Political Economy 99 (3): 500–521. https://doi.org/10.1086/261764.
[134]Restuccia, Diego, and Richard Rogerson. 2008. “Policy Distortions and Aggregate Productivity with Heterogeneous Establishments.” Review of Economic Dynamics 11 (4): 707–20. https://doi.org/10.1016/j.red.2008.05.002.
[135]Restuccia, D., and R. Rogerson. 2017. “The Causes and Costs of Misallocation.” Journal of Economic Perspectives 31(3): 151–74.
[136]Rodrik, Dani, Arvind Subramanian, and Francesco Trebbi. 2004. “Institutions Rule : The Primacy Over in Economic and Integration Geography Development.” Journal of Economic Growth 9 (2): 131–65.
[137]Romer, Paul M. 1987. “Growth Based on Increasing Returns Due to Specialization.” The American Economic Review 77 (2): 56–62. https://doi.org/10.2307/1805429.
[138]———. 1990. “Endogenous Technological Change.” Journal of Political Economy 98 (5): S71–102. https://doi.org/10.1086/261725.
[139]Sachs, Jeffrey D. 2003. “Institutions Dont Rule: Direct Effects of Geography on per Capita Income.” 9490. NBER Working Paper.
[140]SAS Institute Inc. 2017. “Principal Components or Factor Analysis?” 2017. https://community.jmp.com/t5/JMP-Blog/Principal-components-or-factor-analysis/bc-p/50703#M3325, accessed on 15 March 2018.
[141]Schumpeter, Joseph. 1942. “Capitalism, Socialism and Democracy. ”New York: Harper & Row.
[142]Solow, R. M. 1956. “A Contribution to the Theory of Economic Growth.” The Quarterly Journal of Economics 70 (1): 65–94. https://doi.org/10.2307/1884513.
[143]Straub, Stéphane. 2008. “Infrastructure and Growth in Developing Countries : Recent Advances and Research Challenges.” World Bank Policy Research Working Paper. https://doi.org/10.1596/1813-9450-4460.
[144]Svirydzenka, Katsiaryna. 2016. “Introducing a New Broad-Based Index of Financial Development.” 16/5. IMF Working Paper.
[145]Swan, T. 1956. “Economic Growth and Capital Accumulation.” Economic Record 32 (2): 334–61. https://doi.org/10.1111/j.1475-4932.1956.tb00434.x.
[146]Syverson, Chad. 2011. “What Determines Productivity?” Journal of Economic Literature 49 (2): 326–65. https://doi.org/10.1257/jel.49.2.326.
[147]Ulku, Hulya, and Arvind Subramanian. 2004. “R&D, Innovation, and Economic Growth: An Empirical Analysis.” ?IMF Working Paper. https://doi.org/10.5089/9781451859447.001.
[148]Wei, Zheng, and Rui Hao. 2011. “The Role of Human Capital in Chinas Total Factor Productivity Growth: A Cross-Province Analysis.” The Developing Economies 49 (1): 1–35. https://doi.org/10.1111/j.1746-1049.2010.00120.x.
[149]WHO/UNICEF. 2017a. “Improved Sanitation Facilities (% of Population with Access).” 2017.
[150]———. 2017b. “Improved Water Source (% of Population with Access).” 2017.
[151]Woo, Wing Thye, Stephen Parker, and Jeffrey Sachs. 1997. “Economies in Transition: Comparing Asia and Europe.” The MIT Press.
[152]World Bank. 2003. “World Development Report 2004 : Making Services Work for Poor People.”World Bank. https://openknowledge.worldbank.org/handle/10986/5986.
[153]World Bank. 2017a.“Doing Business 2017: Equal Opportunity for All. ”Washington, DC: World Bank Group. https://doi.org/10.1596/978-1-4648-0948-4.
[154]———. 2017b. “Employment to Population Ratio, 15+, Total (%) (Modeled ILO Estimate).” World Development Indicators. 2017.
[155]———. 2017c. “Fixed Telephone Subscriptions (per 100 People).” World Development Indicators. 2017.
[156]———. 2017d. “GDP (Constant 2010 US$).” World Development Indicators. 2017.
[157]———. 2017e. “GDP per Capita (Constant 2010 US$).” World Development Indicators. 2017.
[158]———. 2017f. “Government Expenditure on Education, Total.” World Development Indicators. 2017.
[159]———. 2017g. “Gross Capital Formation (Constant 2010 US$).” World Development Indicators. 2017.
[160]———. 2017h. “Labor Market Regulation Indicators.” Doing Business Database. 2017.
[161]———. 2017i. “Mobile Cellular Subscriptions (per 100 People).” World Development Indicators. 2017.
[162]———. 2017j. “Oil Rents (% of GDP).” World Development Indicators. 2017.
[163]———. 2017k. “Patent Applications, Nonresidents.” World Development Indicators. 2017.
[164]———. 2017l. “Patent Applications, Residents.” World Development Indicators. 2017.
[165]———. 2017m. “Population, Total.” World Development Indicators. 2017.
[166]———. 2017n. “Population Ages 0-14 (% of Total).” World Development Indicators. 2017.
[167]———. 2017o. “Research and Development Expenditure (% of GDP).” World Development Indicators. 2017.
[168]———. 2017p. “Scientific and Technical Journal Articles.” World Development Indicators. 2017.
[169]———. 2017q. “Share of Women in Wage Employment in the Nonagricultural Sector (% of Total Nonagricultural Employment).” World Development Indicators. 2017.
[170]———. 2017r. “World Development Report 2017: Governance and the Law. ”World Bank. http://www.worldbank.org/en/publication/wdr2017.
[171]Young, Alwyn. 2017. “Consistency without Inference: Instrumental Variables in Practical Application.” London School of Economics Working Paper. http://personal.lse.ac.uk/YoungA/ConsistencyWithoutInference.pdf.
(責(zé)任編輯:吳思)
Abstract: This is the background paper for the productivity extension of the World Banks Long-Term Growth Model (LTGM). Based on an extensive literature review, the paper identifies the main determinants of economic productivity as innovation, education, market efficiency, infrastructure, and institutions. Based on underlying proxies, the paper constructs indexes representing each of the main categories of productivity determinants and, combining them through principal component analysis, obtains an overall determinant index.This is done for every year in the three decades spanning 1985–2015 and for more than 100 countries. In parallel, the paper presents a measure of total factor productivity (TFP), largely obtained from the Penn World Table, and assesses the pattern of productivity growth across regions and income groups over the same sample. The paper then examines the relationship between the measures of TFP and its determinants. The variance of productivity growth is decomposed into the share explained by each of its main determinants, and the relationship between productivity growth and the overall determinant index is identified. The variance decomposition results show that the highest contributor among the determinants to the variance in TFP growth is market efficiency for Organisation for Economic Co-operation and Development countries and education for developing countries in the most recent decade. The regression results indicate that, controlling for country- and time-specific effects, TFP growth has a positive and significant relationship with the proposed TFP determinant index and a negative relationship with initial TFP. This relationship is then used to provide a set of simulations on the potential path of TFP growth if certain improvements on TFP determinants are achieved. The paper presents and discusses some of these simulations for groups of countries by geographic region and income level. In addition, as a country-specific illustration, the paper presents simulations on the potential path of TFP growth for China under various scenarios.
Keywords: Productivity;Innovation;Education; Efficiency; Infrastructure; Institutions; Growth
猜你喜歡
甘肅教育(2020年14期)2020-09-11 07:57:42
遼金歷史與考古(2019年0期)2020-01-06 07:44:44
中國(guó)衛(wèi)生(2016年7期)2016-11-13 01:06:26
中國(guó)衛(wèi)生(2016年11期)2016-11-12 13:29:18
中國(guó)衛(wèi)生(2016年9期)2016-11-12 13:27:58
時(shí)代英語(yǔ)·高二(2015年1期)2015-03-16 00:08:11
中國(guó)衛(wèi)生(2014年11期)2014-11-12 13:11:32
體育師友(2011年2期)2011-03-20 15:29:29
 中國(guó)經(jīng)濟(jì)報(bào)告2019年5期
- 中國(guó)經(jīng)濟(jì)報(bào)告的其它文章
- 從互聯(lián)網(wǎng)到區(qū)塊鏈—協(xié)同互利新經(jīng)濟(jì)倫理正在形成
- 金融控股公司會(huì)計(jì)信息披露及風(fēng)險(xiǎn)監(jiān)管研究
- 金融供給側(cè)結(jié)構(gòu)性改革視角下的銀行業(yè)改革發(fā)展
- 中國(guó)住房金融體系的發(fā)展進(jìn)程、邏輯及對(duì)策
- 2019中國(guó)企業(yè)500強(qiáng)的特征、問(wèn)題與挑戰(zhàn)
- 中國(guó)制造業(yè)數(shù)字化轉(zhuǎn)型的特點(diǎn)、問(wèn)題與對(duì)策