社會-經濟-自然復合生態系統生態位評價模型
——以四川省為例
2016-11-29 00:39:31汪嘉楊宋培爭
生態學報 2016年20期
汪嘉楊,宋培爭,張 碧,劉 偉,張 菊
成都信息工程大學資源環境學院, 成都 610041
?
社會-經濟-自然復合生態系統生態位評價模型
——以四川省為例
汪嘉楊*,宋培爭,張 碧,劉 偉,張 菊
成都信息工程大學資源環境學院, 成都 610041
在深入分析區域資源、環境、社會、經濟綜合系統基礎上,建立了四川省2001—2010年社會-經濟-自然復合生態系統生態位評價指標體系,復合生態系統綜合生態位包括資源、環境、經濟和社會4個子系統生態位。將耦合投影尋蹤模型應用于復合生態系統生態位評價,其中,采用并行模擬退火算法對評價模型參數進行優化。研究結果表明:2001年—2010年四川省復合生態位呈現先降后升的趨勢,復合生態位評價值從2001年3.1325下降到2005年的2.8499,從2005年開始,復合生態位逐漸增加,到2010年增加到3.3304。表明環境重視程度的提高,環保意識的加強,促進了復合生態位的提高,區域自然生態和環境得以改善。最佳投影方向各分量的大小反映了各評價指標對生態位評價等級的影響程度,值越大則對應的評價指標對生態位評價等級的影響程度越大。區域生態位評價等級指標的影響程度最大的10項中有4項是環境生態位子系統指標,表明環境生態位子系統對綜合生態位影響最大。發展過程中經濟生態位子系統和社會生態位子系統指標值相關系數為0.9957,表明兩子系統基本上是保持同步發展。而經濟生態位和環境生態位子系統指標值相關系數為-0.9346,呈現明顯的負相關關系。資源子系統呈現上升趨勢。模擬退火優化的投影尋蹤耦合模型應用于復合生態位評價,具有實用性和可行性,為區域生態管理科學決策提供重要依據。
復合生態系統;生態位;評價指標;投影尋蹤;模擬退火
生態位一詞又稱生態龕,最早由 Grinnell[1]于1917 年提出,將生態位視為物種的要求及在一特定群落中與其他物種關系的地位,反映生物種群所占據的基本生活單位,主要指物理空間方面。1927年Elton[2]將生態位定義為有機體在與環境的相互關系中所處的功能地位。1957年Hutchinson[3]提出n維超體積的生態位概念,將生態位定義為生物個體或物種不受限制生活的多維生態因子空間。1959年,Odum[4]認為生態位是一個物種在其群落和生態系統中的地位和狀況,而此地位和狀況取決于該生物的生理反應、形態適應和特有的行為。至今,生態位的概念還在不斷地補充和完善中,但其本質都是生物與環境之間關系的定性或定量描述,反映出生物在環境中所處的地位和發揮的功能。作為生態學重要的基礎理論之一,生態位的概念、理論和模型逐步得到發展和完善,不僅越來越廣泛地運用于生態學研究,而且逐漸滲透并運用于社會科學各個領域[5-9],在社會生態系統研究方面同樣具有重要的意義。
人類社會實質上是由社會、經濟和自然3個不同性質的系統構成社會-經濟-自然復合生態系統[10]。該系統反映了一個區域的現狀對于人類各種經濟活動和生活活動的適宜程度,以及一個區域的性質、功能、地位、作用及其人口、資源、環境的優劣勢[10]。在該復合系統中,一個區域可以被視為一個“物種”,也具有相應的生態位。復合生態系統生態位反映了該區域在多個區域構成的大環境中所占據的地位和發揮的作用及其在資源環境方面的優劣勢,體現出不同類型經濟活動以及不同職業、年齡人群的吸引力和離心力[11]。區域的經濟、社會發展水平和環境狀況決定了它的吸引力,決定了它在對應的經濟子系統、社會子系統和自然子系統中的地位和作用,進而決定了這個區域在經濟、社會、自然復合生態系統中的生態位。社會-經濟-自然復合生態系統的生態位研究,能夠對人類在這個復雜生態系統中的活動和生活有一定的影響,對于省域可持續發展道路有一定的促進作用[8-9]。
由于社會-經濟-自然復合生態系統的生態位涉及到資源、環境、經濟、社會等諸多方面,需要構建適應于區域實際情況的評價指標體系及評價模型。近年來,不同學者通過構建生態城市生態位評價指標體系,對不同的區域進行了研究[12-15]。本文借鑒國內外有關可持續發展理論、宜居城市指標體系以及人類發展等評價指標的基礎之上,構建了四川省復合生態系統生態位的指標體系和評價方法,分別從環境、資源、社會、經濟等4個方面對社會-經濟-自然復合生態系統進行生態位變化評價。
近年來,社會經濟自然復合生態系統的生態位評價方法主要有全排列多邊形綜合指數法、生態足跡法、因子分析法,生態足跡法等[15- 20]。文獻[19]運用全排列多邊形綜合指數法計算徐州市生態位及復合生態系統綜合生態位,文獻[9]對2003年中國各省、自治區、直轄市的復合生態系統生態位做出定量評價。文獻[10]采用因子分析法建立了福建省67個縣級行政區綜合生態位評價體系。其中,因子分析法屬于傳統統計分析方法,在計算因子得分時,采用的是最小二乘法,此法有時可能會失效。在實際應用中,對數據量和成分也有要求。全排列多邊形法計算簡單,但無法反映出各指標對綜合評價結果的貢獻率大小。生態足跡分析法是一種基于靜態指標的分析方法,參數取值具有人為主觀性,分析結論需要結合生態足跡需求和供給比較得出,適用于全球、國家層次的評估,難以推廣到較小地域范圍,很難深入到地區發展的各個環節,所提出的政策建議也就無法做到豐富和具體。探索新的生態位評價方法,發展多種不確定性分析方法在復合生態系統生態位評價中的應用,是推動和豐富生態學發展的一個重要方向。
投影尋蹤技術(Projection pursuit,PP)是用來處理和分析高維數據的一種探索性數據分析的有效方法,通過對數據本身進行挖掘,尋找反映高維數據本身特征的投影[21- 22],在低維空間上對數據結構進行分析,最大限度的反映數據自身特征,信息量不會丟失,避免了人為賦權的主觀干擾,使評價結果合理、真實。同時,最優投影方向還可以反映出各評價指標對綜合評價結果的影響程度,即各指標的貢獻率的大小,為決策提供參考依據[21- 22]。因此,本文采用投影尋蹤模型模擬區域生態位變化過程,并采用并行模擬退火算法(Simulated Annealing,SA)[23]對模型參數進行優化,耦合模型對復合生態系統和子系統的生態位和進行了定量分析和評價,為區域生態管理科學決策提供重要依據。
1 社會-經濟-自然復合生態系統生態位評價指標體系的建立
根據四川省的實際情況,構建的社會-經濟-自然復合生態位評價指標體系包括目標層、亞目標層和指標層3個層次,目標層是復合生態系統,亞目標層包括社會、經濟、自然生態系統,自然生態系統分為資源和環境兩個子生態系統,指標層數據來源于四川省統計年鑒,具體的指標和數據見表1。
資源生態位:資源生態位研究人口分布與自然資源承載能力之間的關系[10],選用7個指標進行分析評價。人均耕地面積代表土地資源水平,人均水資源量代表水資源水平。森林覆蓋率反映一個國家或地區森林面積占有情況或森林資源豐富程度及實現綠化程度的指標。人均林木蓄積量反映當前人均活立木的材積總量。森林覆蓋率和人均林木蓄積量代表四川省森林資源,建成區綠化覆蓋率反映了城市生態綠化情況,旱澇受災面積表明區域受到旱災和洪澇的程度,人均能源生產量用一次性能源生產總量與人口的比值計算得到,代表四川省能源利用情況。
環境生態位:選用6個指標進行分析計算。水土流失治理面積代表的是生態環境的抵御和抵抗災害的能力,環境污染指標主要從經濟發展造成的環境壓力方面考慮,包括工業廢水排放總量、工業煙塵排放量、工業粉塵排放量、工業二氧化硫排放量和工業固廢產生量。
經濟生態位:選用6個指標進行分析評價。人均GDP和人均財政收入,能夠反映四川省的經濟發展水平的高低;單位GDP能耗和單位GDP水耗能夠反映經濟發展能耗水平,單位GDP能耗用全省每年能耗值與每年GDP值的比值計算;人均進出口貿易總額反映對外經濟的發展情況;人均貨運量反映交通運輸的能力。
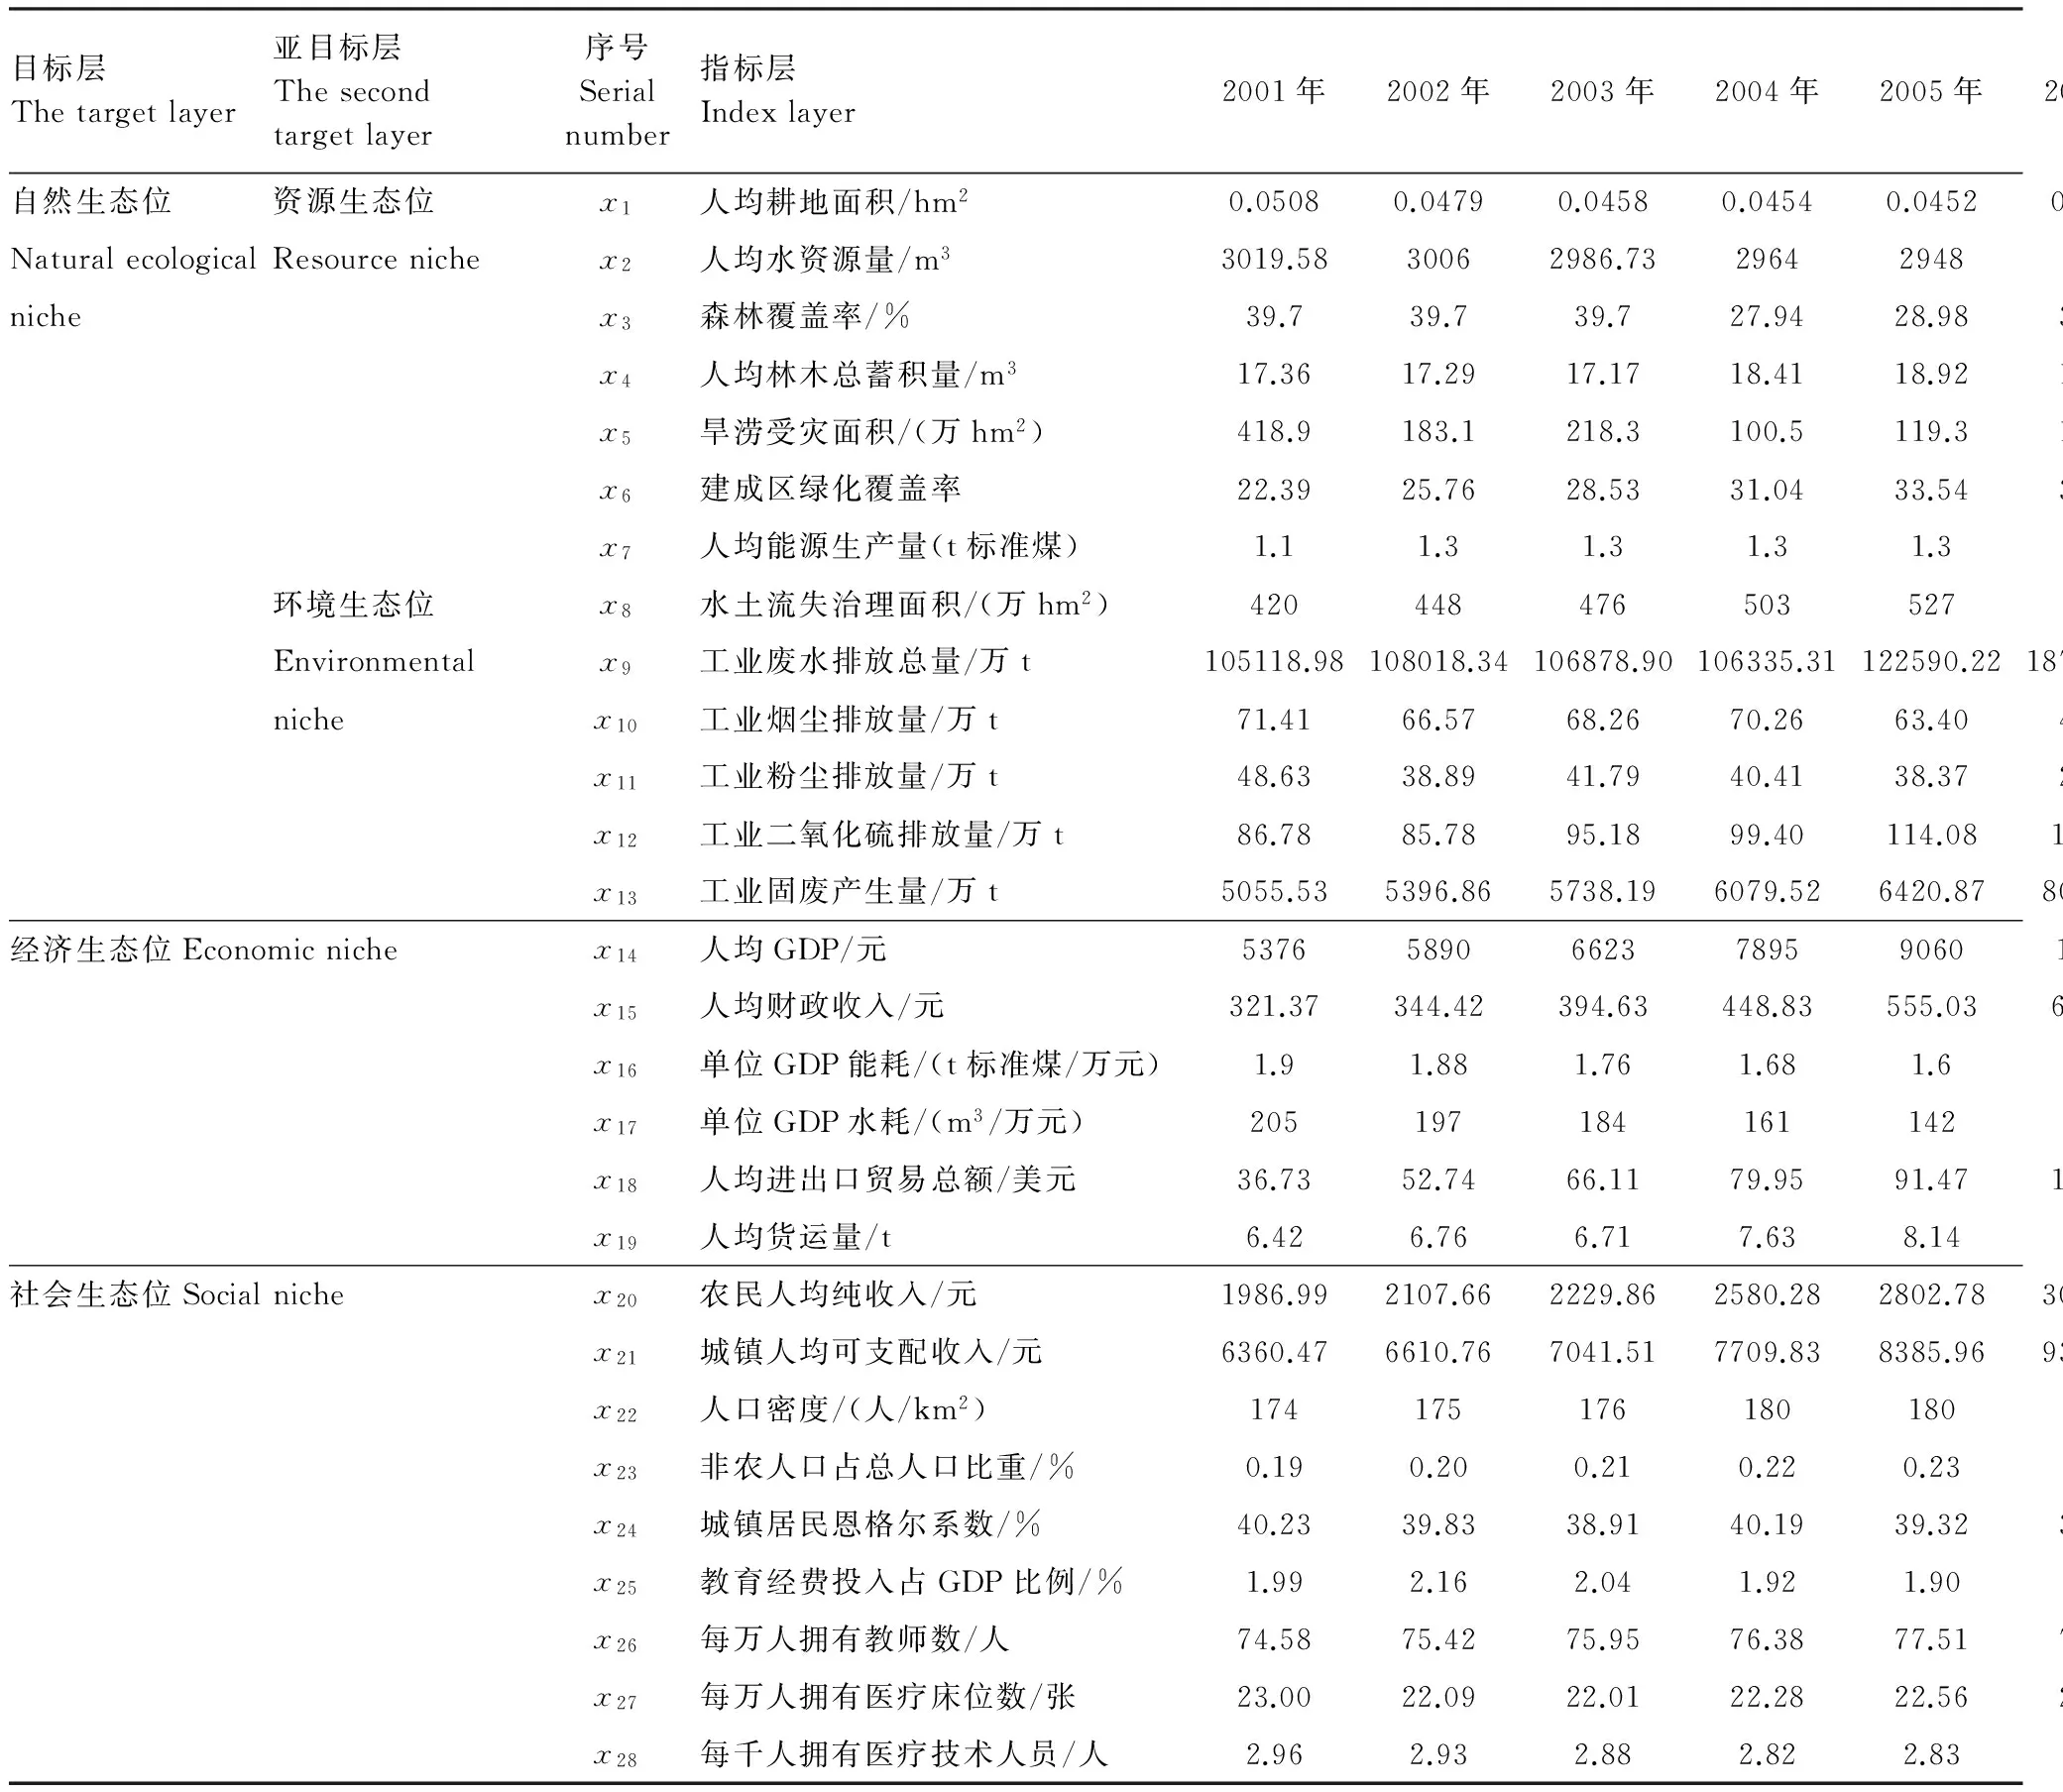
表1 社會-經濟-自然復合生態系統評價指標體系
社會生態位:選用9個指標作為代表性指標。城鎮居民恩格爾系數是衡量一個家庭或一個國家富裕程度的主要標準之一;農民人均純收入、城鎮人均可支配性收入和城鎮居民恩格爾系數反映人民生活水平;人口密度表示四川省人口分布情況;非農人口占總人口比重用來衡量城市化率;教育經費投入占GDP的比例和每萬人擁有教師數就能夠反映出教育保障的情況;每萬人擁有醫療床位數和醫療技術人員數能夠反映醫療保障的情況。
2 模擬退火投影尋蹤(SA-PP)耦合評價模型

2.1 綜合特征值Zi的構造
綜合特征值Zi構造為:
(1)
式中,xij為樣本指標值,aj是投影方向參數,aj∈[-1,1];確定綜合特征值Zi的關鍵是找到反映高維數據特征結構的最優投影方向aj。因此構造一個投影指標函數Q(a),作為優選投影方向的依據,當指標函數達到極值時,即可獲得最優投影方向。
2.2 投影指標函數Q(a)的構造
為了構造投影尋蹤指標函數,引入類間距離和類內密度兩個概念:
類間距離
(2)
類內密度
(3)
構造投影指標
Q(a)=s(a)·d(a)
(4)

2.3 優化投影方向
設定目標函數為:maxQ(a);約束條件:‖a‖=1。目標函數含義為當類間距離最大時,類與類之前達到最好的分離程度,類內密度最大時,本類中各點聚集性越好。此情況下,達到最優分類效果,從而得到更好的評價結果。在滿足約束條件的情況下,求解出Q(a)最大值,也就同時找到了最優投影方向a。優化投影方向的方法很多,此處采用并行模擬退火算法(SA)進行優化,建立耦合的SAPP模型。模擬退火算法原理見文獻[23],基于并行SA優化的SAPP模型實現過程為:
①在解空間內隨機生成初始種群ai, 給定初始溫度、終止溫度、退火形式、同一溫度下內循環次數等;
④退火:退火形式:T(t+1) =γ·T(t),γ為退火系數0<γ<1;
⑤重復執行步驟②—④,直至達到終止條件,并輸出最優解。
3 評價與結果分析
四川省2001—2010年社會-經濟-自然復合生態系統評價的的SAPP評價步驟及結果:
(1)由于各指標評價標準單位不一致,且在數量級上存在很大差異,首先按下式將原始數據規格化處理:
(5)

(2)四川省社會-經濟-自然復合生態系統評價樣本指標值代入SAPP模型中,采用Matlab7.0 語言編程實現。并行SA優化投影尋蹤模型時參數設置如下:種群規模200;退火形式:T(t+1) =γ·T(t),γ= 0.9,t為迭代次數;初始溫度T0=1×10¹⁰,終止溫度Tf= 0;接受概率公式:exp(-Δf/T) > rand,其中rand為(0,1)之間的隨機數。投影指標用式(4)計算,在滿足目標函數maxQ(a)和約束條件‖a‖=1下,經過尋優運算,輸出最優的投影方向向量為:a= (0.0922, 0.0608, 0.0232, 0.1481, 0.1723, 0.2048, 0.3114, 0.0884, 0.2643, 0.379, 0.3639, 0.3318, 0.009, 0.1112, 0.1956, 0.1531, 0.1714, 0.1501, 0.0884, 0.1724, 0.0862, 0.1777, 0.2355, 0.0709, 0.1607, 0.1454, 0.1504, 0.0141),由此可根據式(1)確定四川省社會-經濟-自然復合生態系統評價系統每年的綜合特征值Zi(圖1)。從圖1可以看出,2001年開始,復合生態迅速降低,復合生態位評價值從2001年3.1325下降到2005年的2.8499,在2003年和2005年最低,表明2001—2005年隨著經濟發展而自然生態系統退化程度和環境質量問題較為嚴重。從2005年開始,復合生態位逐漸增加,到2010年增加到3.3304,又恢復到2001年的水平,表明環境重視程度的提高,環保意識的加強,促進了復合生態位的提高,區域自然生態和環境得以改善。
為了與本文的評價結果對比,在式(5)的原始數據規格化基礎上采用多邊形綜合指標法[9]計算四川省歷年生態位評價值,評價結果圖對比如圖1所示。由圖可以看出四川省2001—2010年兩種評價方法的變化趨勢是一致的。
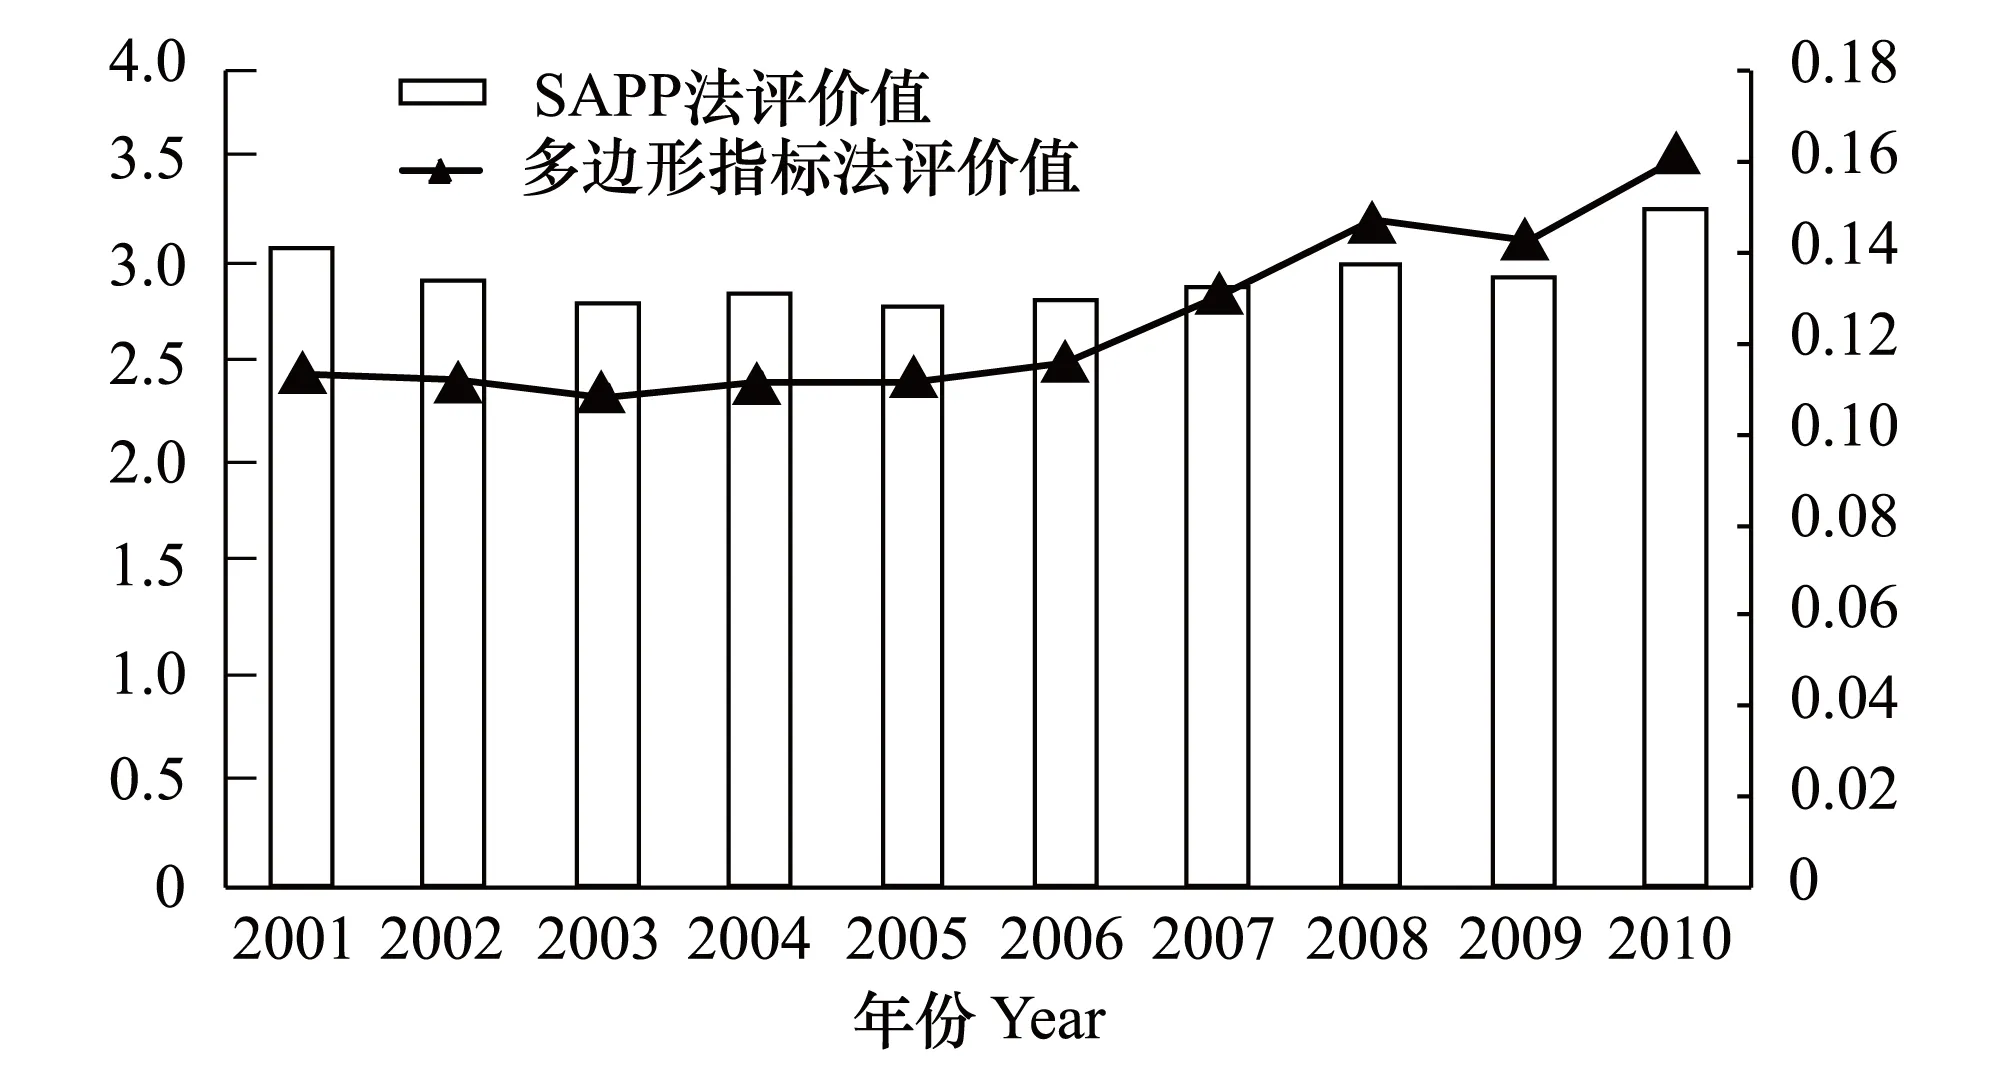
圖1 SAPP法生態位綜合特征值和多邊形指標法評價值 Fig.1 The comprehensive evaluation value of ecological niche of SAPP and polygon index method
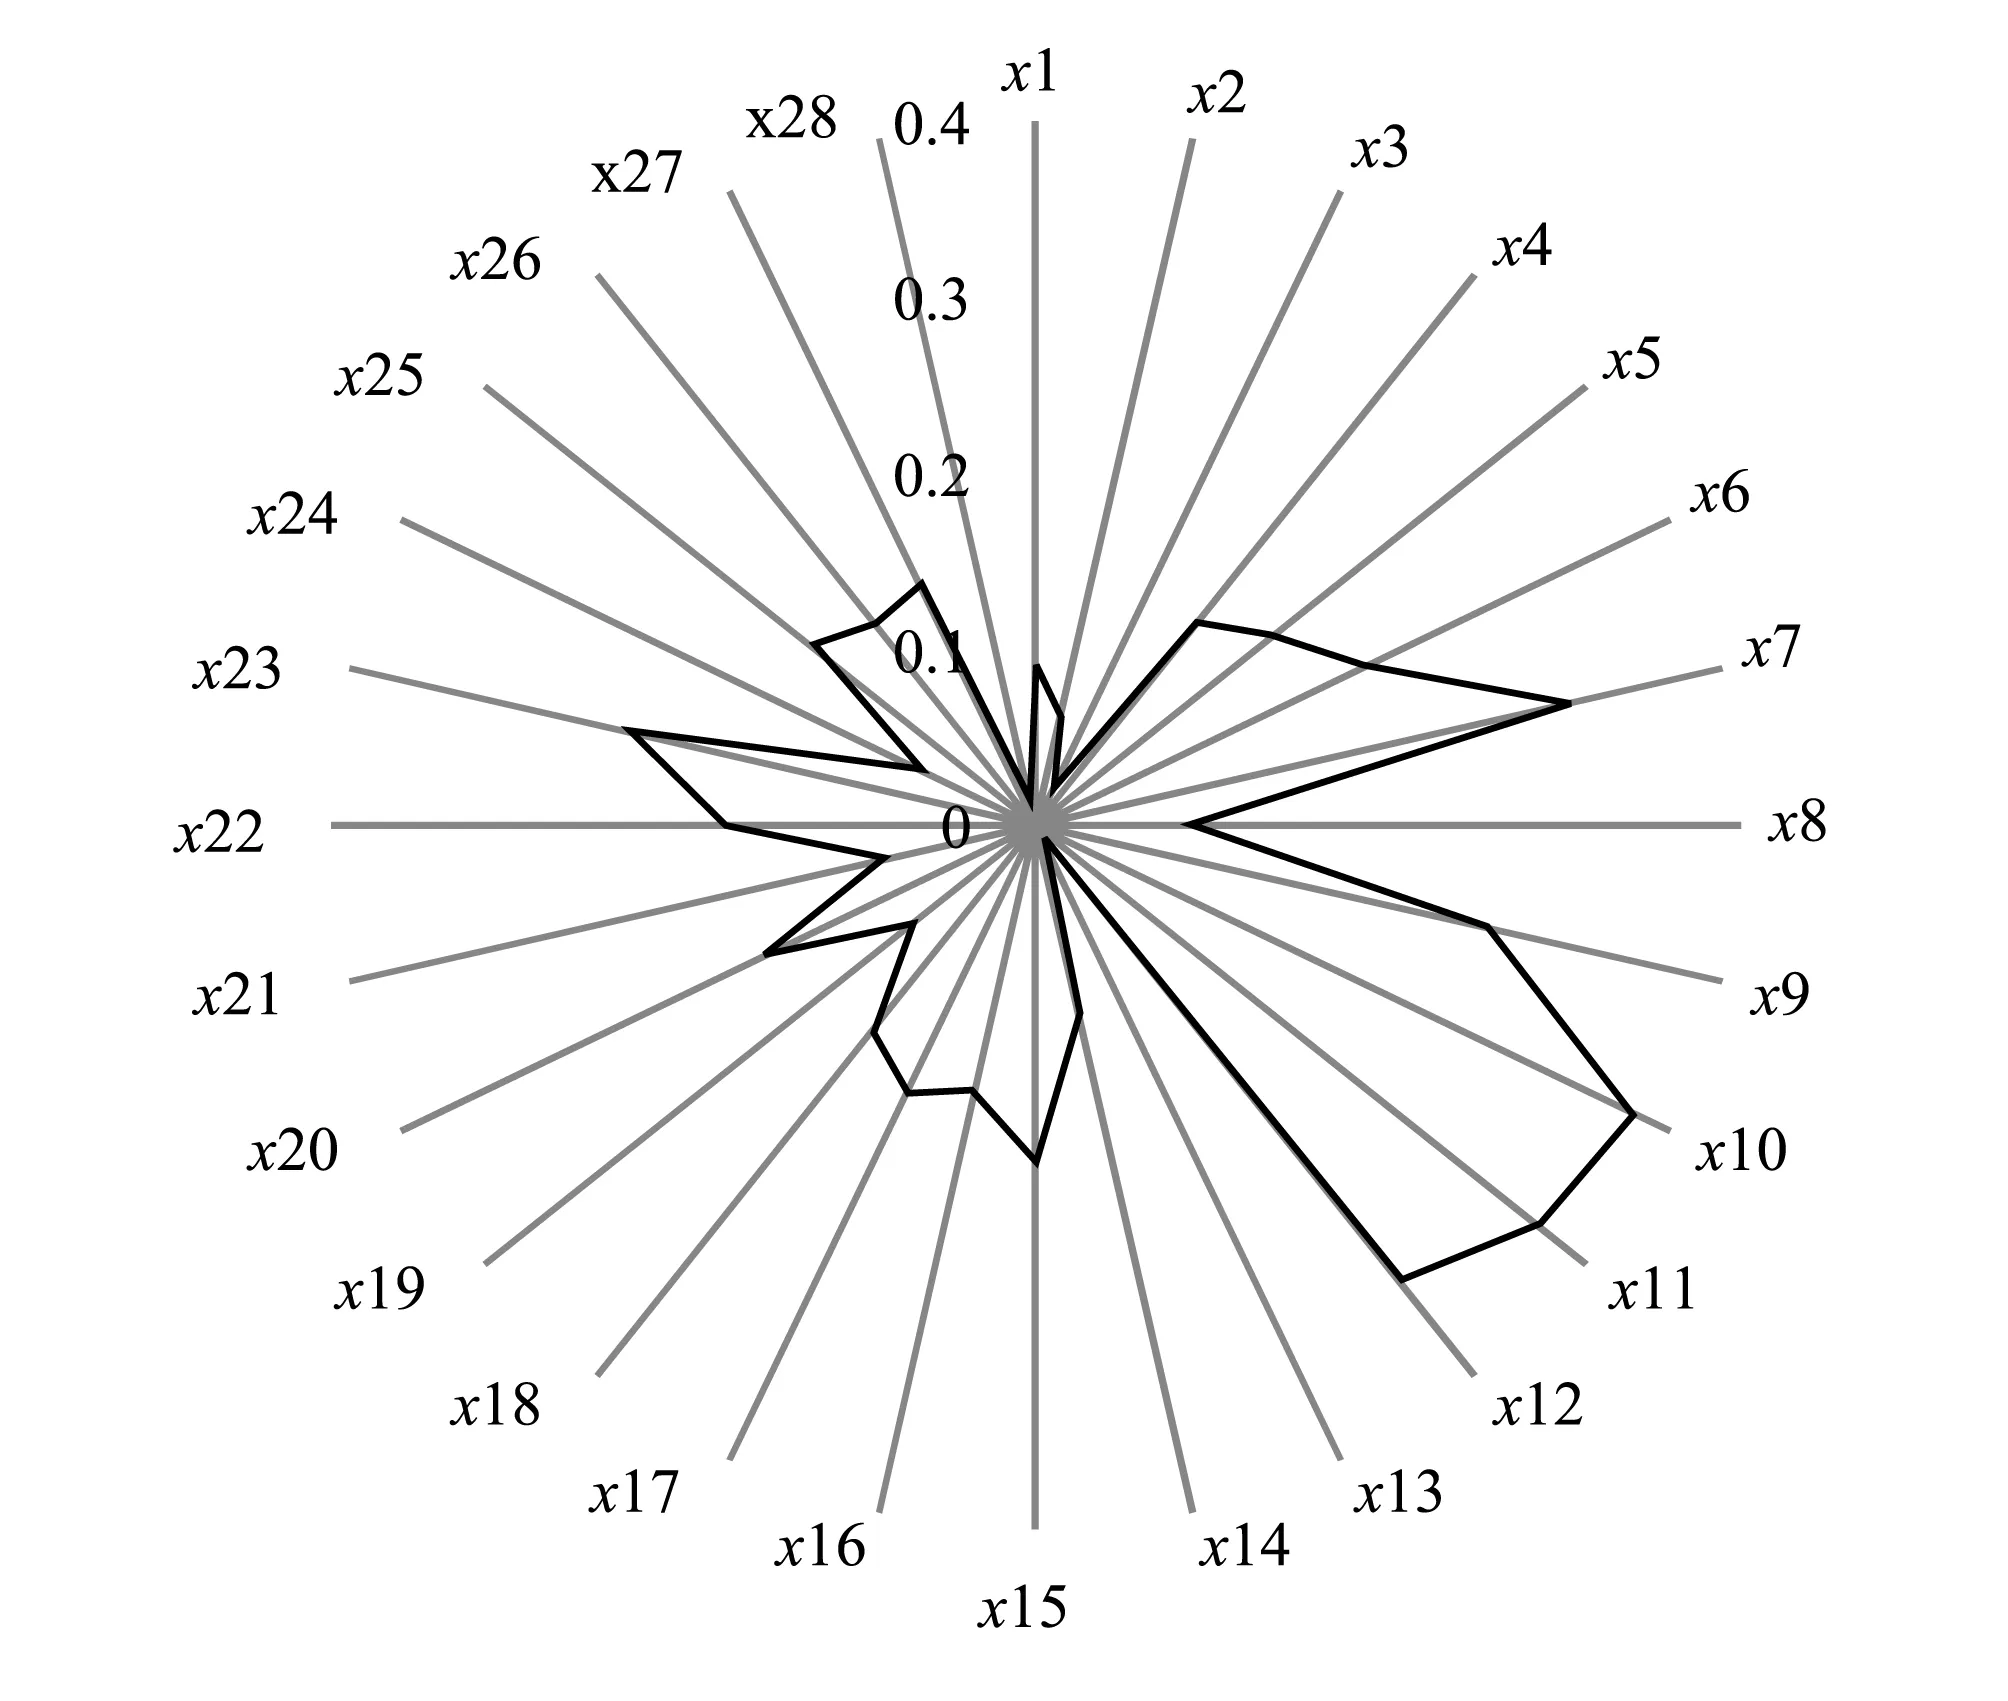
圖2 各指標最佳投影值Fig.2 The best projection value of each index
投影尋蹤模型中,最佳投影方向各分量的大小實質上反映了各個區域評價指標對生態位評價等級的影響程度,值越大則對應的評價指標對生態位評價等級的影響程度越大。據此,可進一步建立區域生態位各個評價指標的權重。在本例中,最佳投影方向a如圖2所示。圖2可以清晰地看出,區域生態位評價等級指標的影響程度最大的10項依次為:工業煙塵排放量>工業粉塵排放量>工業二氧化硫排放量>人均能源生產量>工業廢水排放總量>非農人口占總人口比重>建成區綠化覆蓋率>人均財政收入>人口密度>旱澇受災面積,表明環境生態位子系統對綜合生態位影響最大。

資源生態位:2001—2010年資源生態位呈上升的趨勢,2008年最大值,2009年和2010年又逐漸減少。由于經濟大力發展,需要很多資源消耗,加大了對資源的大力開發利用。環境生態位:環境生態位從2001—2010年間是呈穩定的下降趨勢,環境污染日益嚴重。經濟生態位:經濟生態位也是逐漸呈穩定上升趨勢,表明近10年四川省經濟發展迅速,與此相對的是環境生態位的對應降低,表明經濟發展的同時環境污染加重,四川省現在還處于經濟發展破壞環境的階段。四川省經濟生態位和環境生態位在2001—2010年大體趨勢上是負相關的,這10年間,隨著經濟發展環境污染問題嚴重的趨勢比較明顯。社會生態位:四川省2001 —2010年社會生態位也是呈逐漸緩慢上升的趨勢,說明隨著經濟發展水平的提高,人民的生活保障也在提高,社會保障體系在不斷提高。經濟生態位和社會生態位基本呈正相關關系,經濟生態位高的地區通常情況下社會生態位也比較高,反之則較低,說明區域在發展過程中經濟子系統和社會子系統基本上是保持同步發展。
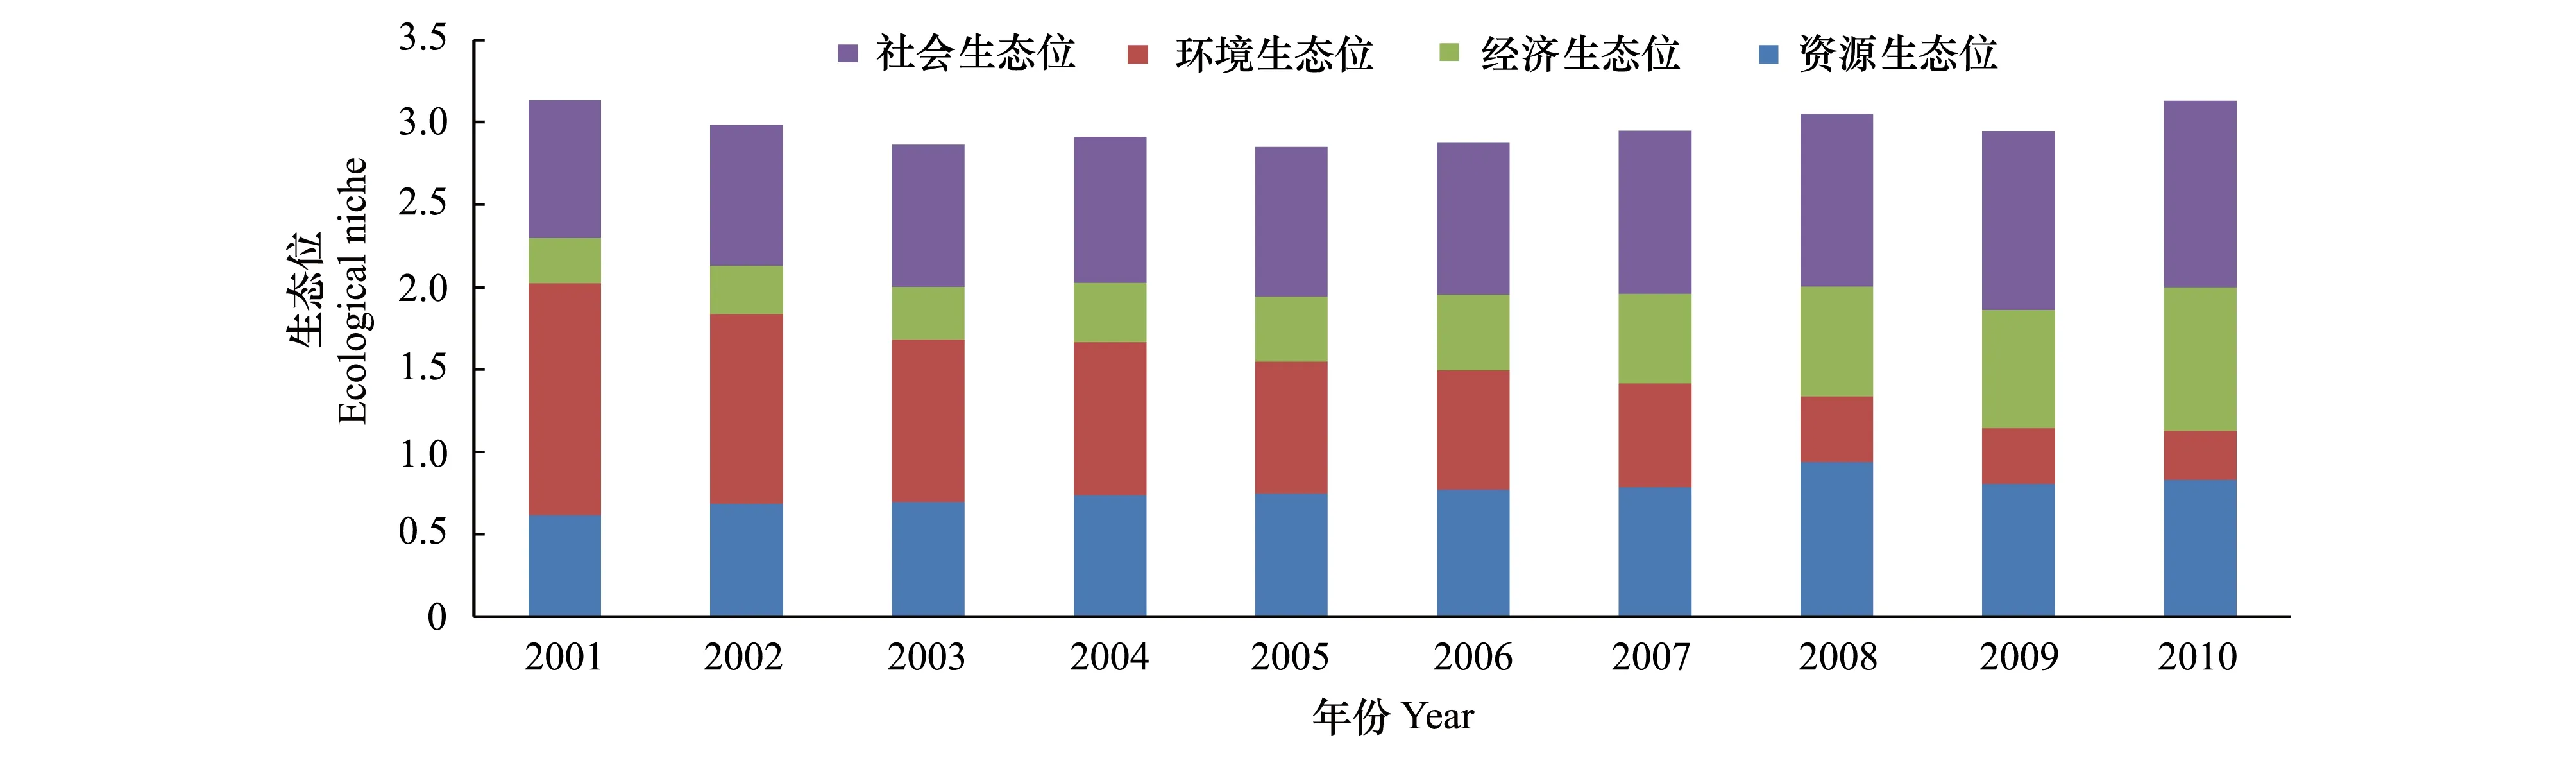
圖3 生態位各子系統特征值計算結果Fig.3 Ecological niche results of each subsystem
4 結論
(1)投影尋蹤算法具有良好的數據分析和處理能力,通過探索發現數據間的規律,得到較好的結果,并可以避免傳統的評價方法在確定各指標權數時的主觀片面性。因此,本文將模擬退火算法用于投影尋蹤優化,構建耦合SAPP模型,并應用于四川省2001—2010年社會-經濟-自然復合生態系統生態位以及各子系統生態位評價,表明了此模型具有實用性和可行性,為區域生態管理科學決策提供重要依據。
(2)2001—2010年四川省復合生態位呈現先降后升的趨勢,復合生態位評價值從2001年3.1325下降到2005年的2.8499,從2005年開始,復合生態位逐漸增加,到2010年增加到3.3304。表明環境重視程度的提高,環保意識的加強,促進了復合生態位的提高,區域自然生態和環境得以改善。經濟生態位子系統和社會生態位子系統指標值相關系數為0.9957,表明兩子系統基本上是保持同步發展。而經濟生態位和環境生態位子系統指標值相關系數為-0.9346,呈現明顯的負相關關系。資源子系統呈現上升趨勢。
(3)最佳投影方向各分量的大小反映了各評價指標對生態位評價等級的影響程度,值越大則對應的評價指標對生態位評價等級的影響程度越大。區域生態位評價等級指標的影響程度最大的10項中有4項是環境生態位子系統指標,表明環境生態位子系統對綜合生態位影響最大。
[1] Grinnell J. Field tests of theories concerning distributional control. The American Naturalist, 1917, 51(602): 115- 128.
[2] Elton C S. Animal Ecology. London: Sedgwick and Jackson, 1927.
[3] Hutchinson G E. Concluding remarks: population studies animal ecology and demography. Cold Spring Harbor Symposia on Quantitative Biology, 1957, 22: 415- 427.
[4] Odum E P. Fundamentals of Ecology. Philadelphia: WB Saunders, 1959.
[5] Han B L, Wang R S, Tao Y, Gao H. Urban population agglomeration in view of complex ecological niche: A case study on Chinese prefecture cities. Ecological Indicators, 2014, 47: 128- 136.
[6] Du H B, Xia Q Q, Ma X, Chai L H. A new statistical dynamic analysis of ecological niches for China′s financial centres. Physica A: Statistical Mechanics and its Applications, 2014, 395: 476- 486.
[7] Funk A, Gsch?pf C, Blaschke A P, Weigelhofer G, Reckendorfer W. Ecological niche models for the evaluation of management options in an urban floodplain—conservation vs. restoration purposes. Environmental Science & Policy, 2013, 34: 79- 91.
[8] 陳亮, 王如松, 王志理. 2003年中國省域社會-經濟-自然復合生態系統生態位評價. 應用生態學報, 2007, 18(8): 1974- 1800.
[9] 李艷春, 王義祥, 黃毅斌. 1996—2006年福建省社會-經濟-自然復合生態系統生態位變化分析. 福建農業學報, 2009, 24(2): 162- 166.
[10] 馬世駿, 王如松. 社會-經濟-自然復合生態系統. 生態學報, 1984, 4(1): 1- 9.
[11] 陳亮, 李愛仙, 劉玫. 區域人口復合生態系統生態位評價. 城市發展研究, 2008, 15(6): 33- 36.
[12] 毛齊正, 羅上華, 馬克明, 鄔建國, 唐榮莉, 張育新, 寶樂, 張田. 城市綠地生態評價研究進展. 生態學報, 2012, 32(17): 5589- 5600.
[13] Chervinski A. Ecological evaluation of economic evaluation of environmental quality. Procedia Economics and Finance, 2014, 8: 150- 156.
[14] Dai J, Chen B, Hayat T, Alsaedi A, Ahmad B. Sustainability-based economic and ecological evaluation of a rural biogas-linked agro-ecosystem. Renewable and Sustainable Energy Reviews, 2015, 41: 347- 355.
[15] Li X B, Tian M R, Wang H, Wang H, Yu J J. Development of an ecological security evaluation method based on the ecological footprint and application to a typical steppe region in China. Ecological Indicators, 2014, 39: 153- 159.
[16] 王健民, 王偉, 張毅, 胡夢春, 唐曉燕, 陳敏. 復合生態系統動態足跡分析. 生態學報, 2004, 24(12): 3920- 2926.
[17] Salvo G, Simas M S, Pacca S A, Guilhoto J J M, Tomas A G R, Abramovay R. Estimating the human appropriation of land in Brazil by means of an Input-Output Economic Model and Ecological Footprint analysis. Ecological Indicators, 2015, 53: 78- 94.
[18] Wu X F, Yang Q, Xia X H, Wu T H, Wu X D, Shao L, Hayat T, Alsaedi A, Chen G Q. Sustainability of a typical biogas system in China: Emergy-based ecological footprint assessment. Ecological Informatics, 2015, 26: 78- 84.
[19] 尤海梅, 王甜, 楊嘉偉, 孔西莙, 程奕. 徐州市復合生態系統生態位的變化分析. 徐州師范大學學報: 自然科學版, 2011, 29(3): 69- 72.
[20] 金書秦, 王軍霞, 宋國君. 生態足跡法研究述評. 環境與可持續發展, 2009, 34(4): 26- 29.
[21] Michael D S. Statistical Modeling of High-Dimensional Nonlinear Systems: A Projection Pursuit Solution. Atlanta: Georgia Institute of Technology Press, 2005: 13- 88.
[22] Zhang C, Dong S H. A new water quality assessment model based on projection pursuit technique. Journal of Environmental Sciences, 2009, 21(S1): S154-S157.
[23] Richards M, McDonald A J S, Aitkenhead M J. Optimisation of competition indices using simulated annealing and artificial neural networks. Ecological Modelling, 2008, 214(2/4): 375- 384.
An ecological niche evaluation model of social, economic, and natural complex ecosystems: a case study in Sichuan Province
WANG Jiayang*, SONG Peizheng, ZHANG Bi, LIU Wei, ZHANG Ju
DepartmentofResourcesandEnvironment,ChengduUniversityofInformationTechnology,Chengdu610041,China
Human societies are essentially composed of three different systems: social, economic, and natural. Studies on the ecological niche of social, economic, and natural complex ecosystems has significant importance on the activities and lives of humans in a complex ecosystem and the sustainable development of land. In this study, a set of indicator systems were established to evaluate the ecological niche of a complex ecosystem in Sichuan Province from 2001 to 2010, based on the evaluation index theory of sustainable development, urban livability, and human development. The integrated ecological niche of the complex ecosystem included four sub-niches: natural resources, environment, economy, and society. These sub-niches comprised many single-item indicators. A coupling projection pursuit model, in which a parallel-simulated annealing algorithm was employed in parameters of optimization, was applied to quantitatively analyze and assess the ecological niche of the complex ecosystem and each sub-niche. Our results indicate that the ecological niche of the complex ecosystem in Sichuan Province first decreased from 3.1325 in 2001, to 2.8499 in 2005, and then increased to 3.3304 by 2010. Our results indicate that, as public awareness of environmental protection increases, the regional ecological niche index also increases. Additionally, the ecological and environmental situation has improved. The correlation coefficient between the economic niche system and the social niche system was 0.9957, indicating that the two sub-niches develop in synchrony. In contrast, the correlation coefficient between the economic niche system and the environment niche system was -0.9346, suggesting an obvious negative correlation. In total, the resource sub-niche system displayed an upward trend. The best projection direction value reflects the impact of each regional ecological niche evaluation index in the projection pursuit model. The large index value of the ecological niche evaluation corresponds with a great impact on the ecological niche. Four indicators of the environmental-ecological sub-niche have significant impacts on the regional ecological niche. This can further influence the weight of the regional ecological niche evaluation index based on the value of the best projection direction. The ten most influential regional ecological niche evaluation indicators are (from most influential to least influential): Industrial soot emissions > industrial dust emissions > industrial sulfur dioxide emissions > per capita energy yield > total industrial waste water emissions > non-agricultural population accounts for the proportion of the total population > rate of plant coverage in urban areas > per capita revenue > population density > drought affected areas. Of these, four indicators belong to the environmental-ecological niche sub-system, which shows that this system has an essential influence on the entire ecological niche of the area. In comparison, the traditional polygon synthesis index method was used to evaluate the ecological niche in Sichuan Province. The results are in agreement with those calculated by the current projection pursuit algorithm, which verified the correctness of our improved algorithm. Furthermore, the projection pursuit algorithm may be used to discover the rules among data through automatic exploration, and thus has excellent potential in data analysis and processing applications. This algorithm may be used to avoid the subjective one-sidedness of the traditional evaluation method of weight determination. The projection pursuit model, optimized by simulated annealing, is practical and feasible in composite niche evaluation. This model is able to provide an important basis for scientific decision making in regional ecological management.
complex ecosystem; ecological niche; evaluation index; projection pursuit; simulated annealing
國家社會科學基金項目(13BGL009);國家自然科學基金項目(51209024, 41101542);四川省社會科學項目(SC14C007, SC15TJ019);四川省教育廳項目(15ZA0192, 15ZA0189)
2015- 04- 14;
日期:2016- 01- 22
10.5846/stxb201504140755
*通訊作者Corresponding author.E-mail: wjj@cuit.edu.cn
汪嘉楊,宋培爭,張碧,劉偉,張菊.社會-經濟-自然復合生態系統生態位評價模型——以四川省為例.生態學報,2016,36(20):6628- 6635.
Wang J Y, Song P Z, Zhang B, Liu W, Zhang J.An ecological niche evaluation model of social, economic, and natural complex ecosystems: a case study in Sichuan Province.Acta Ecologica Sinica,2016,36(20):6628- 6635.
猜你喜歡
中老年保健(2021年12期)2021-08-24 03:30:40
保健醫苑(2021年7期)2021-08-13 08:48:02
中國傳媒大學學報(自然科學版)(2021年1期)2021-06-09 08:43:00
學生天地(2020年36期)2020-06-09 03:12:30
小學科學(學生版)(2020年5期)2020-05-25 07:11:32
中國生殖健康(2020年6期)2020-02-01 06:28:50
中國生殖健康(2019年11期)2019-01-07 01:28:02
中國科技博覽(2016年2期)2016-04-25 20:32:39
小學生導刊(2016年34期)2016-04-11 00:49:44
電測與儀表(2015年5期)2015-04-09 11:30:52